Cryptocurrencies are considered a high-risk asset class. Investing in them may result in the loss of part or all of your capital. The content on this website is intended solely for informational and educational use and should not be interpreted as financial or investment advice.
Why Trust Us
ICO Bench was created by a team of crypto experts to help current and future crypto investors find the latest cryptocurrency ICOs and presales. All content follows a strict editorial policy that ensures factual accuracy, neutrality, and usefulness.
We strive to provide insightful content that helps our audience make informed decisions, while emphasizing the importance of prioritizing safety and risk management. All information in our content is based on thorough research conducted by our team of copywriters and editors. We use proven sources to find relevant projects and ensure that all content is updated regularly.
The information provided by ICO Bench should be used for informational purposes only and should not be taken as investment advice.
Being an early investor can be more beneficial than waiting for new tokens to hit centralized exchanges for regular trades. The low entry prices allow you to maximize your gains when the tokens become public. We’ll guide you on the latest ICO drops in 2025.
We’ll cover the best ICO drops 2025 with a detailed review of each token, including their tokenomics. You’ll also learn how ICOs work if you are new to cryptocurrency launches. With that in mind, let’s begin with a brief overview of the ICO drops cryptocurrencies and their unique use cases.
Step 1: Download the Best Wallet app from the official website or app store to ensure you’re installing the authentic and secure application.
Step 2: Open the app and create your account by following the on-screen instructions, setting a strong, unique password, and enabling security features like two-factor authentication for enhanced protection.
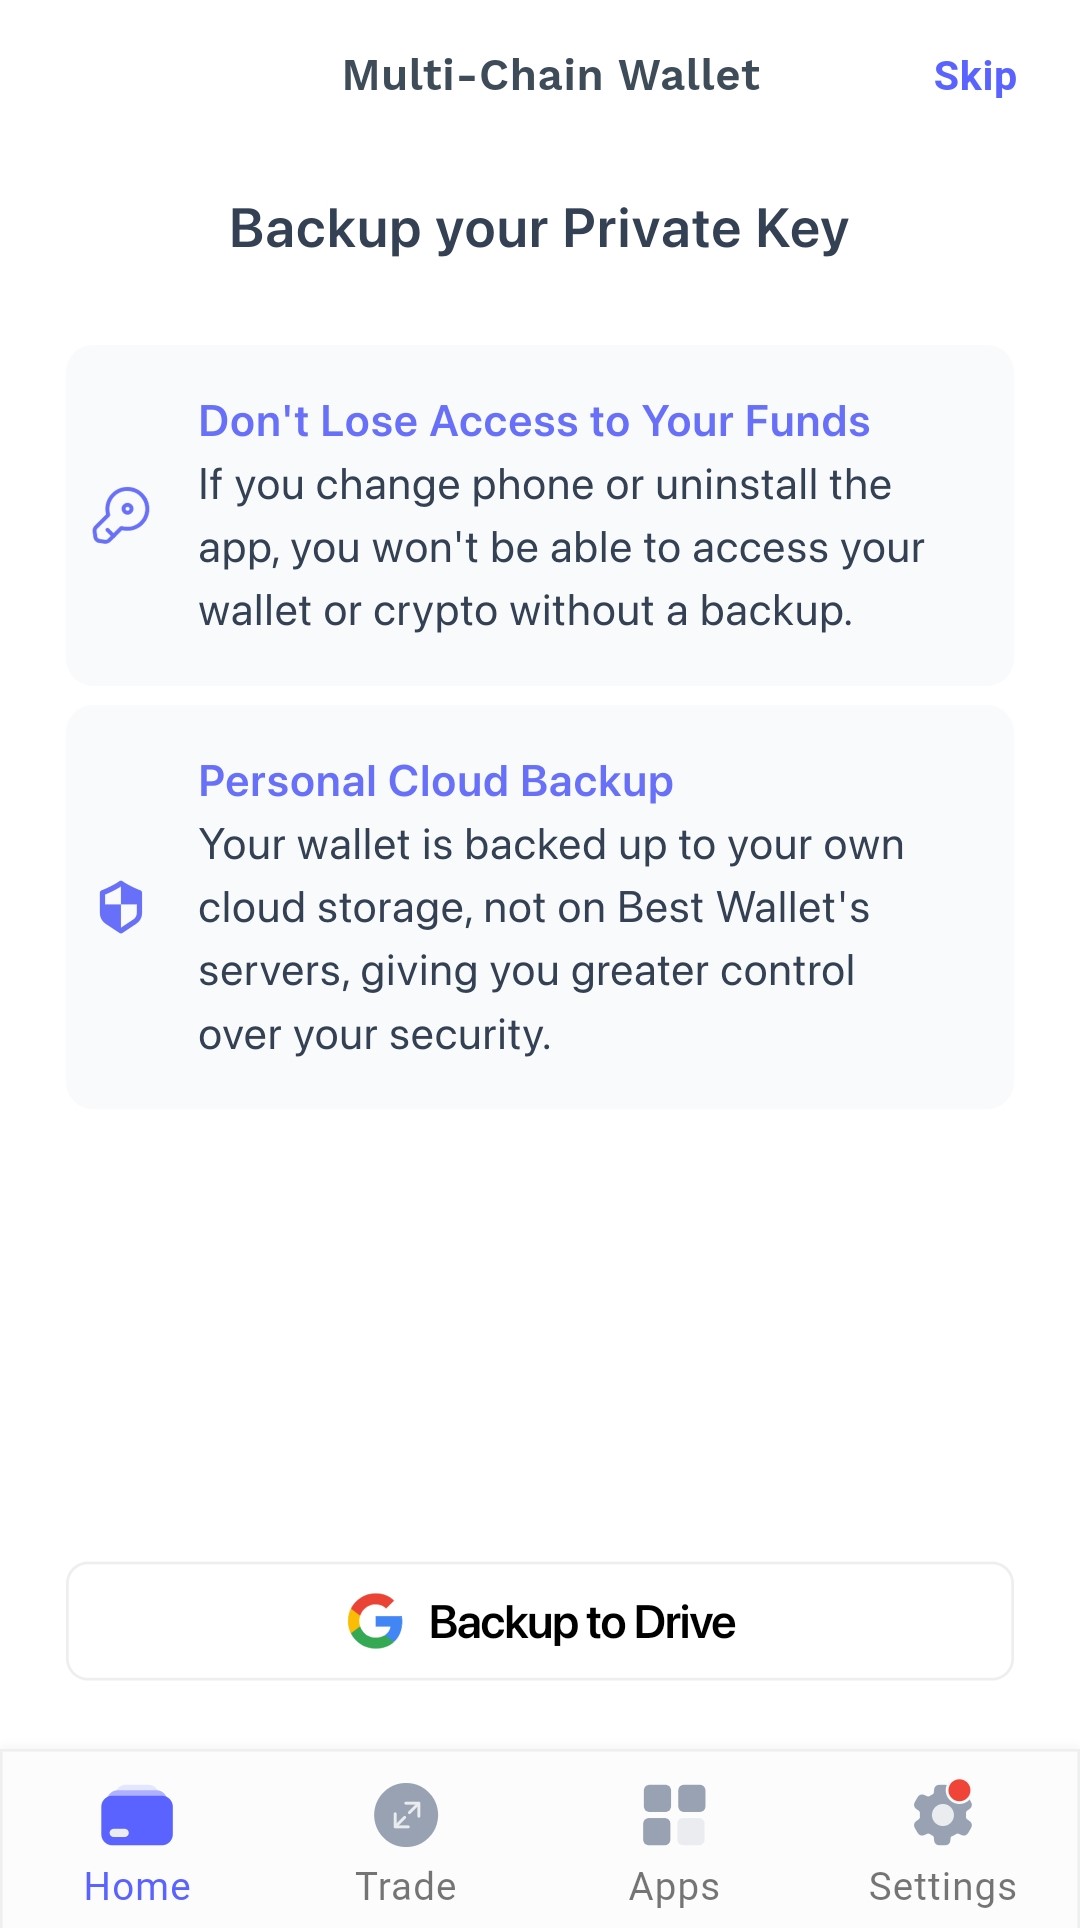
Step 3: When prompted, securely record your recovery phrase—typically a series of 12 or 24 words—by writing it down on paper and storing it in a safe place; this phrase is essential for recovering access to your wallet if needed.
Step 4: Get immediate access ongoing ICOs drops, exclusive presales, airdrops and more.
Some ICOs continue to become successful cryptocurrencies in the industry. They can bring hundred-and-a-thousand-time returns to early investors.
We’ve rounded up the best crypto ICO Drops in the following list:
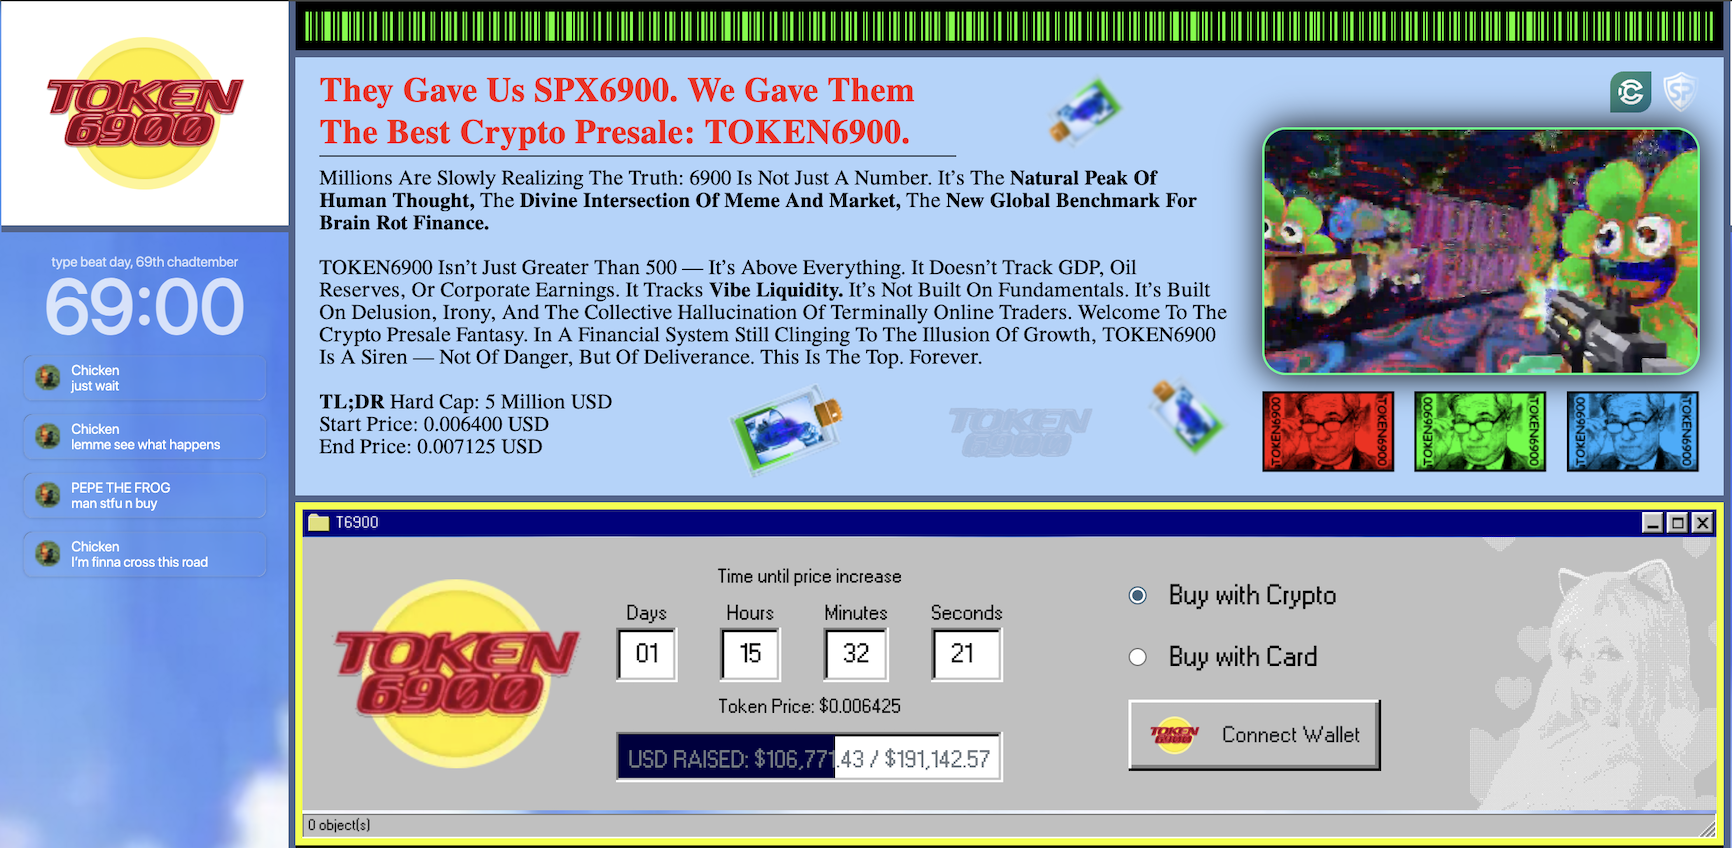
1. TOKEN6900—A New Self-Aware Meme Coin ICO
If you want a token that doesn’t make bogus promises of solving one blockchain problem or the other, then TOKEN6900 fits the bill. The token has zero utility for its holders or the ecosystem. Instead, it is a self-aware meme token with vibe liquidity and a push to see how far the crypto community will value a token without utility.
The TOKEN6900 token presale isn’t the first to walk this path of the “number go up for no reason” genre. SPX6900 walked it before and was largely successful when its price rose exponentially between April and June 2025. Hence, TOKEN6900 has the potential to replicate and even exceed that success rate.
While you won’t get any utility if you buy the $T6900 token, you’ll qualify for airdrops and other community incentives. The airdrops, together with the community rewards and token burns, make up 5% of the total token allocation. And with token burns, you can expect scarcity to push the token’s value higher.
The TOKEN6900 presale is ongoing with a hard cap of $5 million. To participate, simply visit the official presale website. Alternatively, you can buy the token directly from Best Wallet.
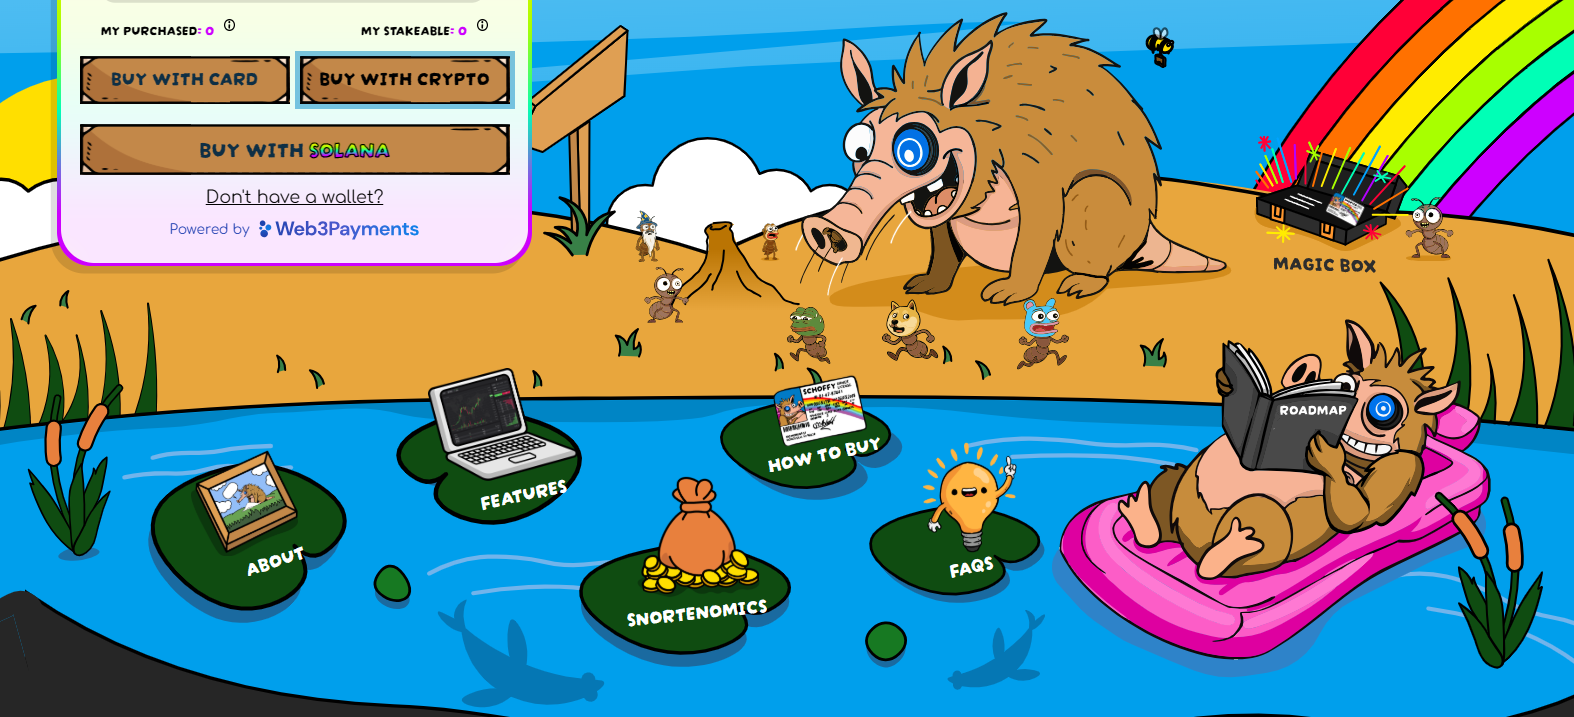
2. Snorter Token – A New ICO Drop for a Multi-chain Meme Token
The Snorter token embodies the meme culture, but it doesn’t end there. It also offers utility that many meme coin traders will find helpful, especially if they want to get trading opportunities as soon as they appear. The Snorter token brings speedy transaction executions, including automated sniping of on-chain tokens.
Buying the Snorter token allows you to use the Snorter bot. This bot can work with you as you schedule purchases and even exit positions. You don’t have to keep an eye on the market, as the bot will work with your commands and ensure an automated trading session.
The $SNORT token presale is one of the latest ICO drops on Best Wallet now. You can buy the token in Best Wallet and still have the opportunity to stake it for additional rewards. Alternatively, you can connect a supported wallet to the presale website for the purchase. But ensure you use ETH, SOL, USDT, or USDC, as those are the only supported cryptocurrencies.
Note that token claims will come after the $SNORT presales. That is when you will also start receiving the staking rewards.
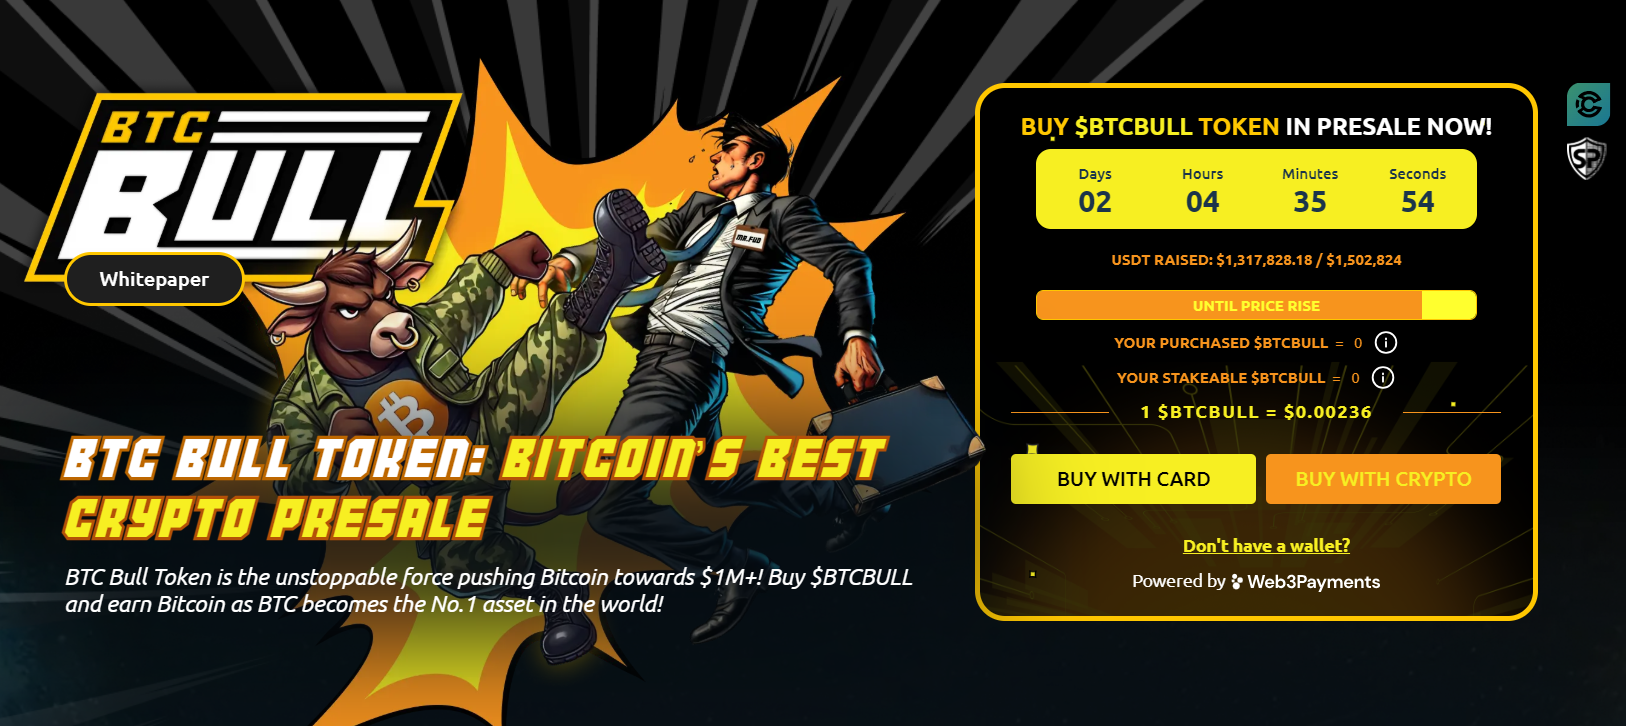
The BTC Bull token is designed to appeal more to Bitcoin enthusiasts, thanks to the rally for an expected Bitcoin bull market in 2025. Nevertheless, you can still benefit from the new token launch, earn through staking rewards, and receive BTC drops in the process. All these will be possible once you buy BTC Bull.
If you are to buy BTC Bull, we recommend you do so now, as the token is currently going for well under $0.01. The starting price in its presale was $0.00235, but we expect a few price increments throughout the presale stage.
For the purchase, you can do that now via Best Wallet. Download the Best Wallet app, register with your email, fund it with ETH, BNB, or USDT, and buy the BTC Bull token. With that done, you can stake them right away for extra earnings and staking multipliers while waiting for the BTC airdrops. It is also best to buy and stake early, as the estimated rewards will continue to drop as the presale nears its end.
The BTC airdrops will occur directly in the Best Wallet, with the biggest one coming when BTC hits $250k. For the other two airdrops, you’ll get them when BTC reaches $150k and $200k.
4. Best Wallet Token – A Top ICO Drop for Utility Token Enthusiasts
Meme coins may fill up our conversations for a while, but utility tokens are the way to go if you want longevity in your investments. You can get that now with the Best Wallet Token, a new affordable crypto that boasts exclusive utility in its ecosystem. The latter includes the BEST DEX and the Best Card, a crypto debit card for seamless transactions.
The $BEST token has several benefits that will incentivize investors, especially Best Wallet users, to hold it in their wallets. One of those is the exclusive access to new presales. If you want to explore further, then the Best Wallet will bring high APY staking opportunities your way. These are just a few benefits of holding the $BEST token, and we know that the token’s value will likely climb when more people hold it.
$BEST is launching into a competitive market, but its ties to the Best Wallet ecosystem place it among the best ICO drops. As of this writing, the project has raised over $368K and is on its way to full launch. If you want to get the token, you’ll have to go through the Best Wallet app. We will share a step-by-step guide subsequently.
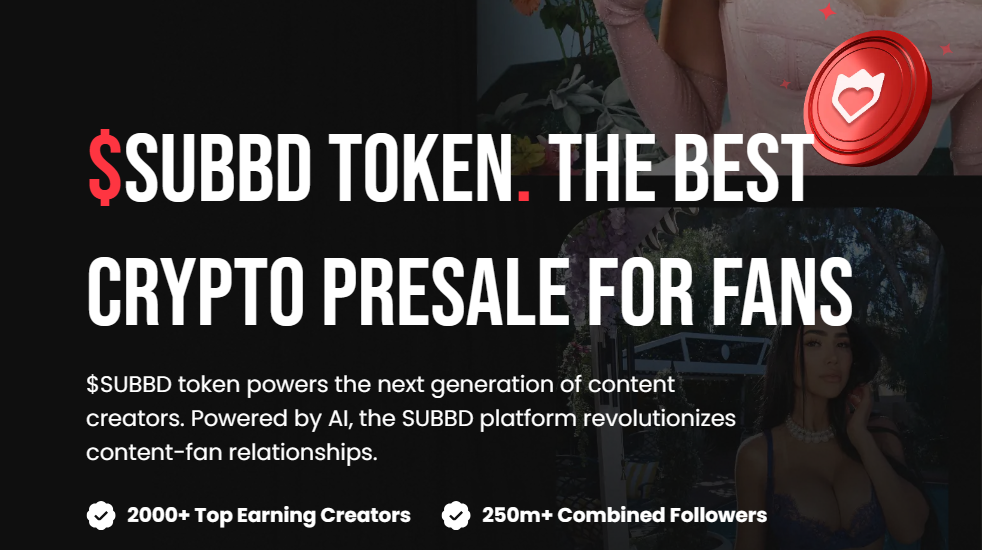
5. SUBBD Token – New ICO Drop for Content Creators
You don’t have to place a camera in front of you to become a content creator. With the SUBBD creator platform, you’ll have access to AI creators who can do that for you, but that’s just the start. These AI creators are more efficient in churning out high-quality content and keeping your followers engaged. You’ll also have the support of AI personal assistants that can help with simple tasks like replying to your followers or even complex ones.
The SUBBD creator platform is an ecosystem that rewards both creators and users. For the creators, they’ll get fewer platform restrictions, lower management fees, a robust AI creator system, and gamification models through the XP multipliers.
Users can buy the SUBBD token to enjoy access to exclusive content, get VIP benefits, enjoy platform discounts, and get early access to beta features. The fees will be much lower and they will have governance rights as well through their tokens.
The $SUBBD token presale kicked off a while back and will continue until all the tokens allocated for the presale are sold out. To get yours, simply connect your wallet to the presale website. Or better still, buy the token directly in Best Wallet.
ICO drop refers to the sale of new cryptocurrencies to investors in exchange for established cryptocurrencies like Bitcoin, Ethereum, and USDT. Those ICOs and crypto airdrops range from different types of altcoins such as meme coins, ai crypto coins, shitcoins or others coins which can explode. Project developers use ICO drops to raise awareness of their tokens and raise funds for the projects’ roadmaps. Investors who purchase these tokens become owners and may participate in governance, depending on the coin’s framework.
Some developers host ICO drops on their websites. Others launch their coins directly on centralized or decentralized exchanges. Either way, you must have a compatible wallet to purchase these tokens during their drops.
Tokens on the Ethereum network will require ETH-compatible wallets. Similarly, coins on the Solana network will require SOL-compatible wallets.
The prices during ICO drops in crypto are often more affordable than when the tokens become widely available. That is why early investors stand a chance to profit off the bull market when it sets in.
Upcoming ICO drops often have whitepapers and other helpful information about the projects. These will help you determine how much potential value the projects bring.
You can keep up with the latest ICO drops through specialized platforms like ours. Find comprehensive information before investing in any new crypto project.
These drops can be available to a few or broader investors. For example, the project team might place its token presales on invitation-only. You can’t purchase such tokens until they become publicly traded on centralized or decentralized exchanges.
How Do ICO Drops Work?
ICO drops go through several stages. Beyond that, the project team uses the funds raised to continue research and development. This aspect is especially essential for utility coins like eTukTuk and 5th Scape.
The stages that ICO drops pass through include the following:
Project research and development: At this stage, the creators outline the project’s technicalities and capital requirements. The tokenomics will also be outlined to define how many tokens will go into different aspects like liquidity, staking rewards, presale, CEX and DEX listings, etc.
The token creation: Based on interest and funding, the project team moves ahead to create the token. These tokens may not be available during presales. Some might be available after the presale but before the complete public launch.
The marketing campaign: Meme coins, like Smog, rely heavily on marketing campaigns to encourage participation. These campaigns display the viability of the tokens and how they intend to reach specified targets. That happens because tokens often have financial targets during their ICOs.
Initial offering: At this stage, investors can purchase the tokens by sending acceptable cryptocurrencies to the token’s smart contract address.
Distribution and listing: The project team will distribute the tokens after the ICO is complete. Then, you can trade them on centralized and decentralized exchanges.
What is the Difference Between ICO, IDO, IEO?
ICOs, IDOs, and IEOs are ways crypto developers raise money or crowdfund their projects. Crypto startups raised $25 billion in 2024 using these strategies. Nonetheless, ICOs, IDOs, and IEOs are different approaches to crowdfunding crypto projects.
IDO refers to the initial DEX offering, while IEO refers to the initial exchange offerings. The table below shows the primary differences between ICO, IDO, and IEO.
Aspect
ICO
IDO
IEO
Launch platform
It is typically on the token’s primary or official website
IDO is done on a decentralized exchange
IEO is done on a centralized crypto exchange.
Definition
A crowdfunding technique where developers offer their tokens directly to the public
The token sale is conducted on a third-party decentralized exchange
A token sale hosted by a centralized exchange
Access to investors
The general public can purchase the tokens
The third-party exchange must vet investors before allowing access.
Only registered users on the centralized exchange can buy the tokens.
Project vetting
There is no need for exchange vetting
A third party must vet the project before it is hosted on the DEX.
The CEX vets the project before hosting it and conducting the token sales.
Risk
Investors must face the risk of scams, rug pulls, and project failures
The decentralized community vets the projects, providing moderate protection
Exchanges often conduct due diligence before hosting projects to eliminate those prone to failure or scams.
Developers use these approaches depending on the scale of their projects and the target audience. The wider the audience, the more they will lean towards initial coin offerings.
How to Find the Best ICO Drops?
The best place to start your search for the best ICO drops is to use an ICO calendar. These tools track the status of ICOs in real time.
Notwithstanding, that doesn’t erase your need for proper and thorough research. The key is finding upcoming ICO drops you are comfortable with and fit your investment goals.
Finding the best ICO drops requires patience and thorough research. We might point you to several ICOs through our timely updates, but it’s up to you to see their viability in relation to your investment goals.
Finding the Best ICO Project Step-by-step
With that in mind, here’s how to find the best ICO drops:
Outline your investment goals: This step is crucial as it reveals how much return you want. The higher your expected returns, the riskier the drops you’ll opt for. Hence, review how much you must invest and whether to spread your investments across different projects or stick with one.
Follow prominent ICO drops calendars: Sign up or maintain consistent visits to prominent platforms that bring the latest updates on ICOs. ICOBench is among several websites that provide insights into upcoming and ongoing crypto presales. These are where you’ll find information on the projects, including expert reviews or risk awareness.
Verify the projects: Some projects undergo auditing to boost their authenticity. You can verify the audit with the auditing firm to ensure its validity. In addition, look for active community engagement and a solid development team with an open and reputable background.
Review the whitepaper: This technical document is essential to the viability of any crypto project. You can tell scams from legitimate tokens by reviewing how the team intends to actualize their goals. Focus on use cases, tokenomics, technology, etc., and look for clarity and feasibility.
Assess the risk: Conduct a proper risk assessment by reviewing how much you might lose if the project fails. Consider the overall market conditions (bull or bear market) and the regulatory environments for such projects. You can also review the competitive landscape to see how the project stands in comparison to other tokens.
How do I buy from ICO Drops?
Purchasing coins during ICOs is easy. Accessibility is open to the general public and once you’ve decided which tokens to buy, follow the steps below to complete the purchase:
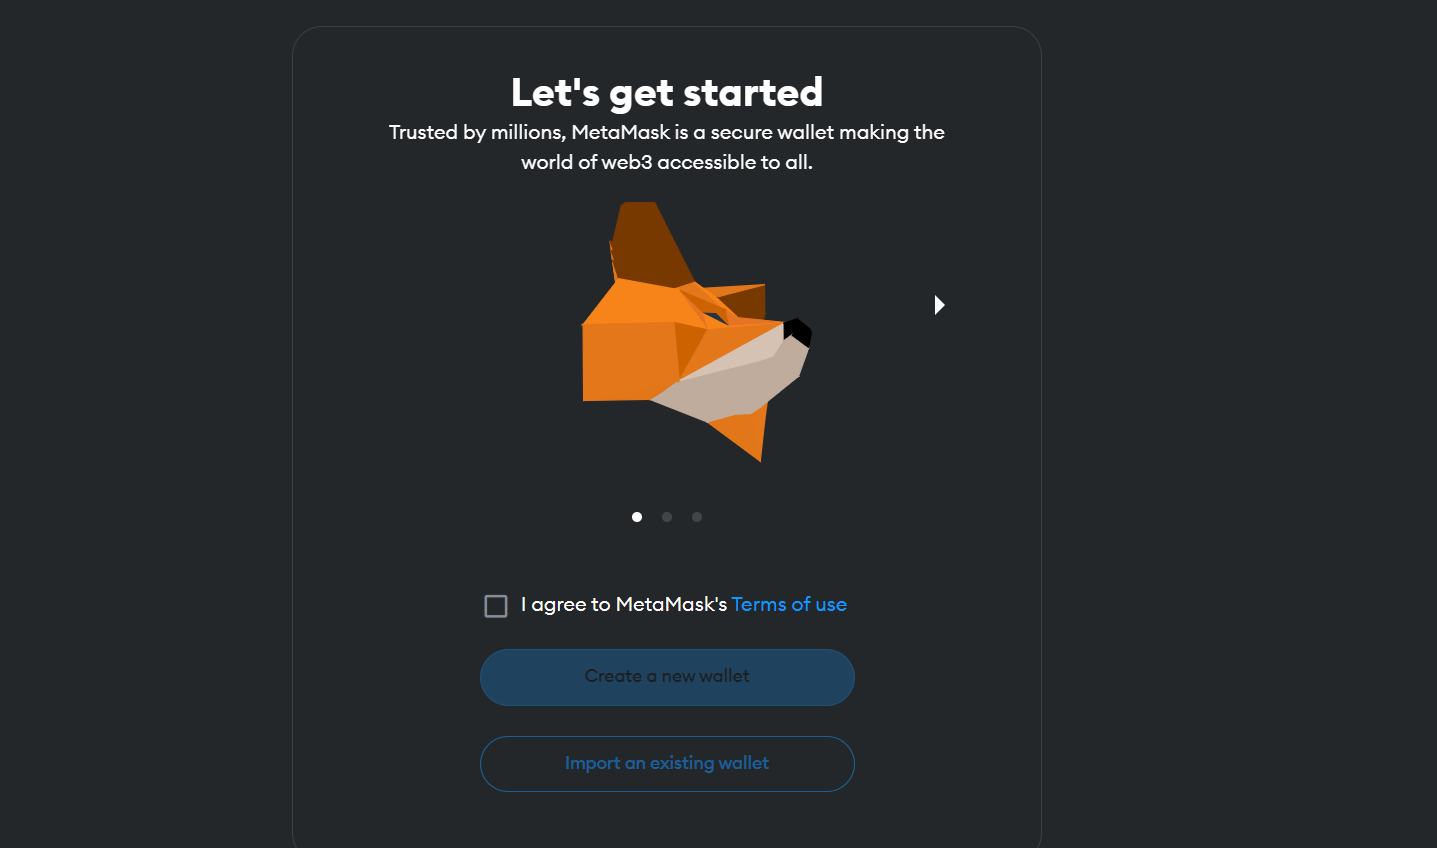
Open a crypto wallet: Go to the token’s official website to find out about compatible wallets. MetaMask, Coinbase Wallet, and Wallet Connect are prominent for ICOs. Open an account with your preference to provide storage for your purchased cryptocurrencies.
Buy ETH or USDT: Go to a reputable exchange to purchase ETH or USDT. These tokens will be used to buy the ICO drops coins on their official websites. Start by inputting the number of tokens you want to buy to see the number of ETH or USDT coins you need.
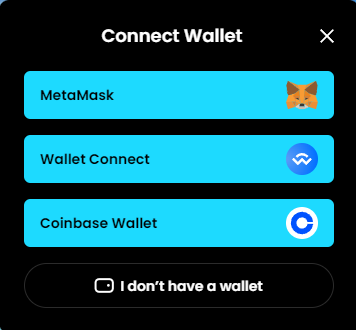
Connect your wallet to the official token website: Go to the token’s official website and click “Connect Wallet.” Select your preferred wallet to connect automatically. This process works on desktops and mobile devices, including tablets.
Swap your ETH or USDT for the tokens: Look for the swap pair that includes ETH or USDT. Input the amount of your ETH you want to swap for the tokens. Ensure you have enough to cover the gas fees.
Claim your tokens: Some ICOs will not have the tokens readily available. Nonetheless, there will be instructions on how to claim the tokens if their availability is not automatic upon purchase. That should be done before the token becomes available on public exchanges for trading.
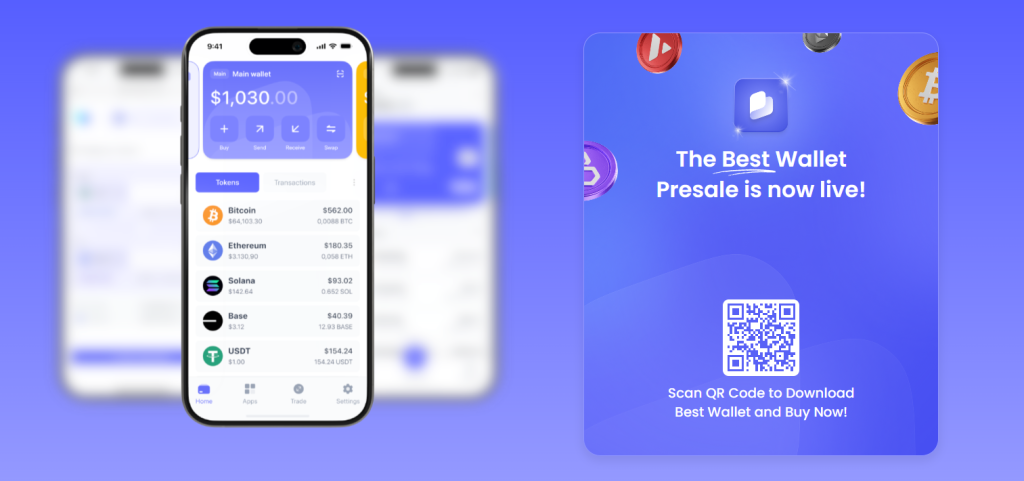
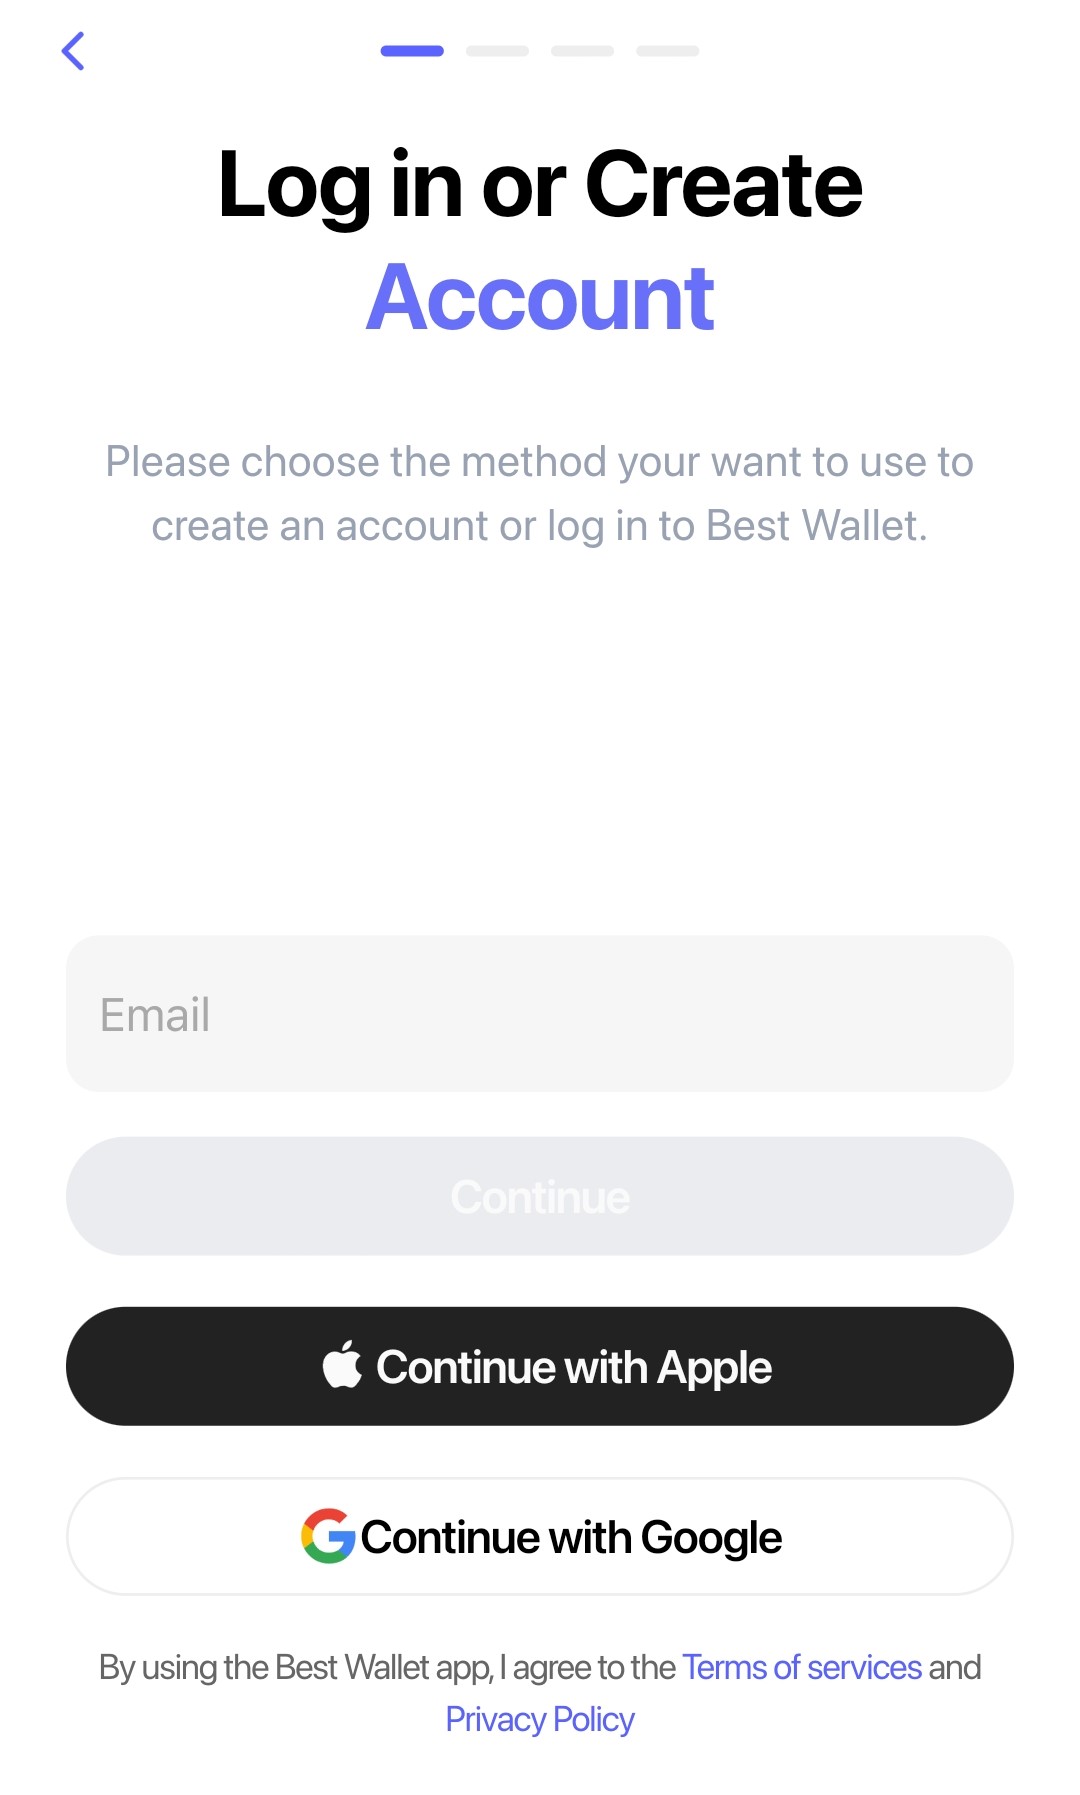
How to Open a Best Wallet (Wallet)
Step 1: Download Best WalletStep 2: Set up your Best accountStep 3: Create a Wallet
Download Best Wallet by clicking the link, or search for it in the App Store or Google Play Store.
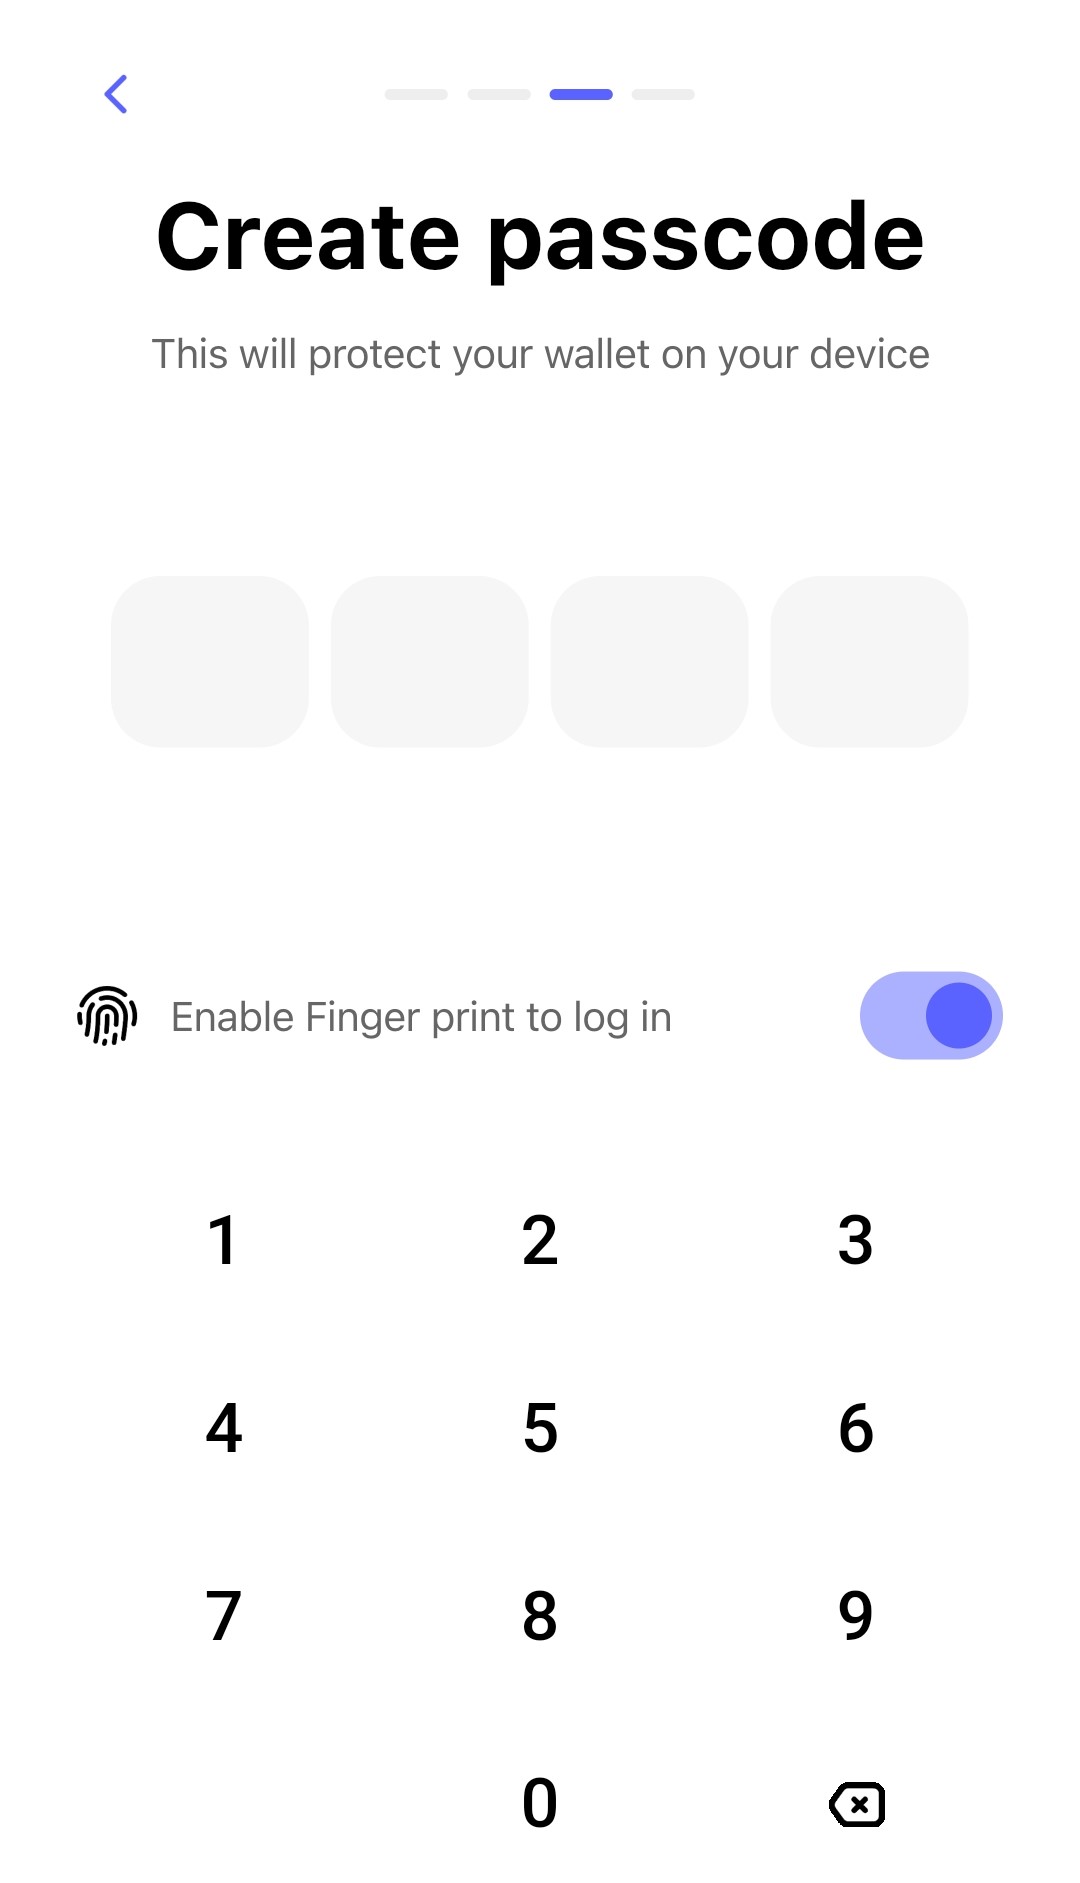
Sign up with your email or use your Google/Apple ID. Best Wallet will automatically create your multi-chain wallet. Set a password for security.
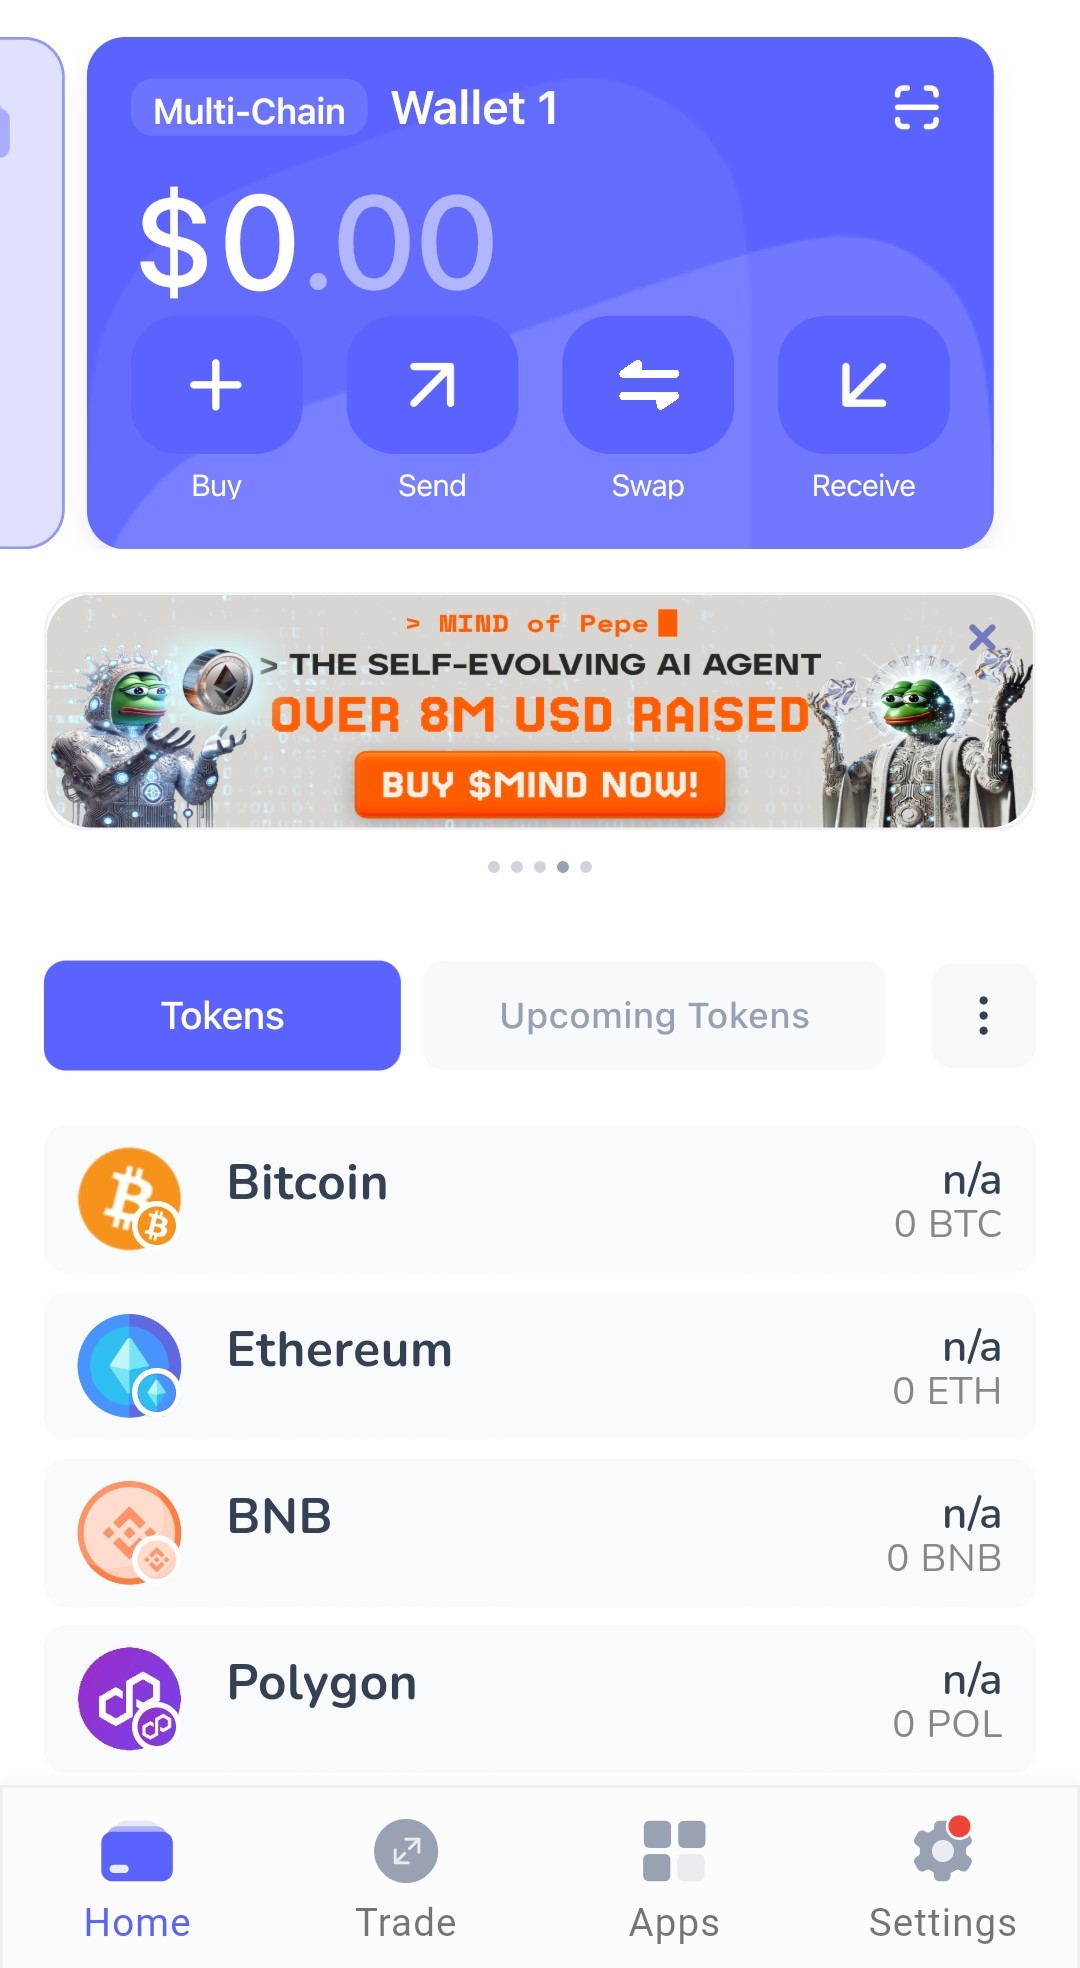
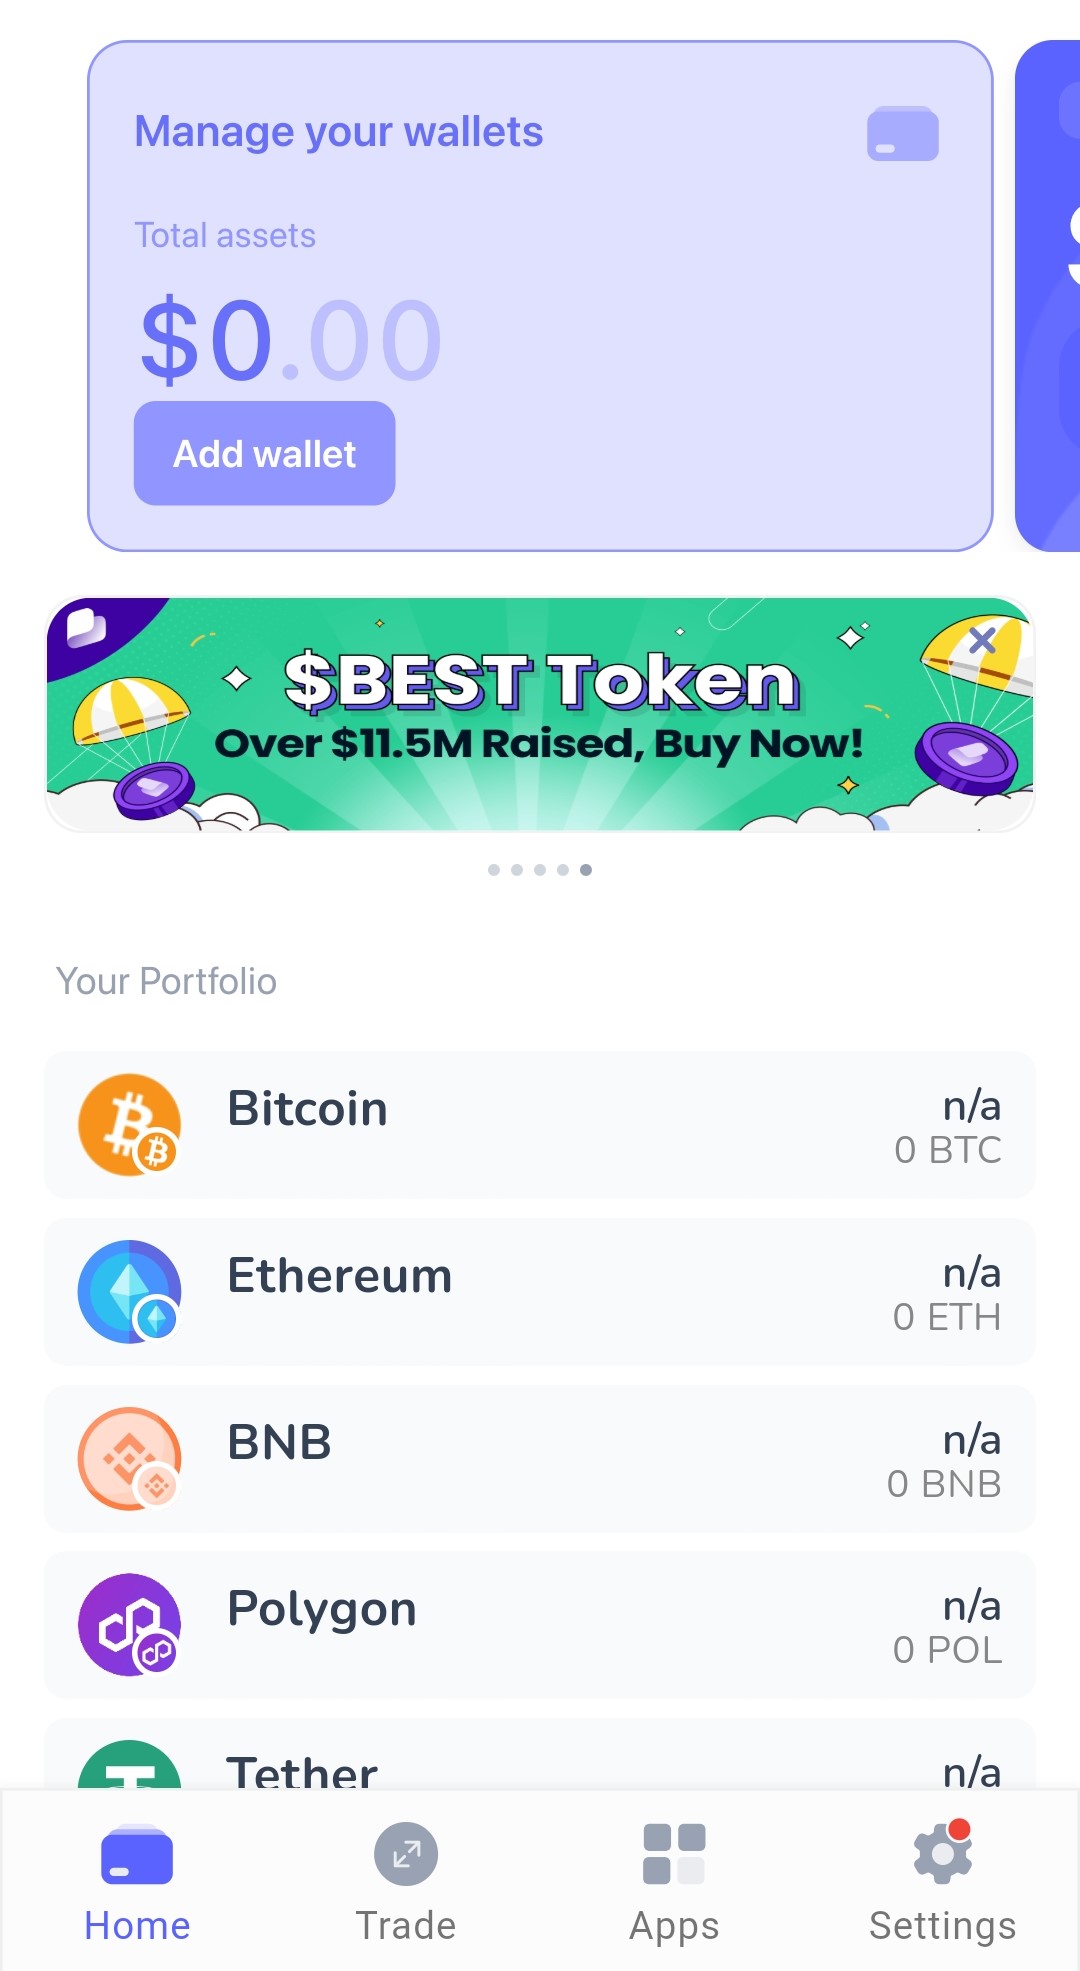
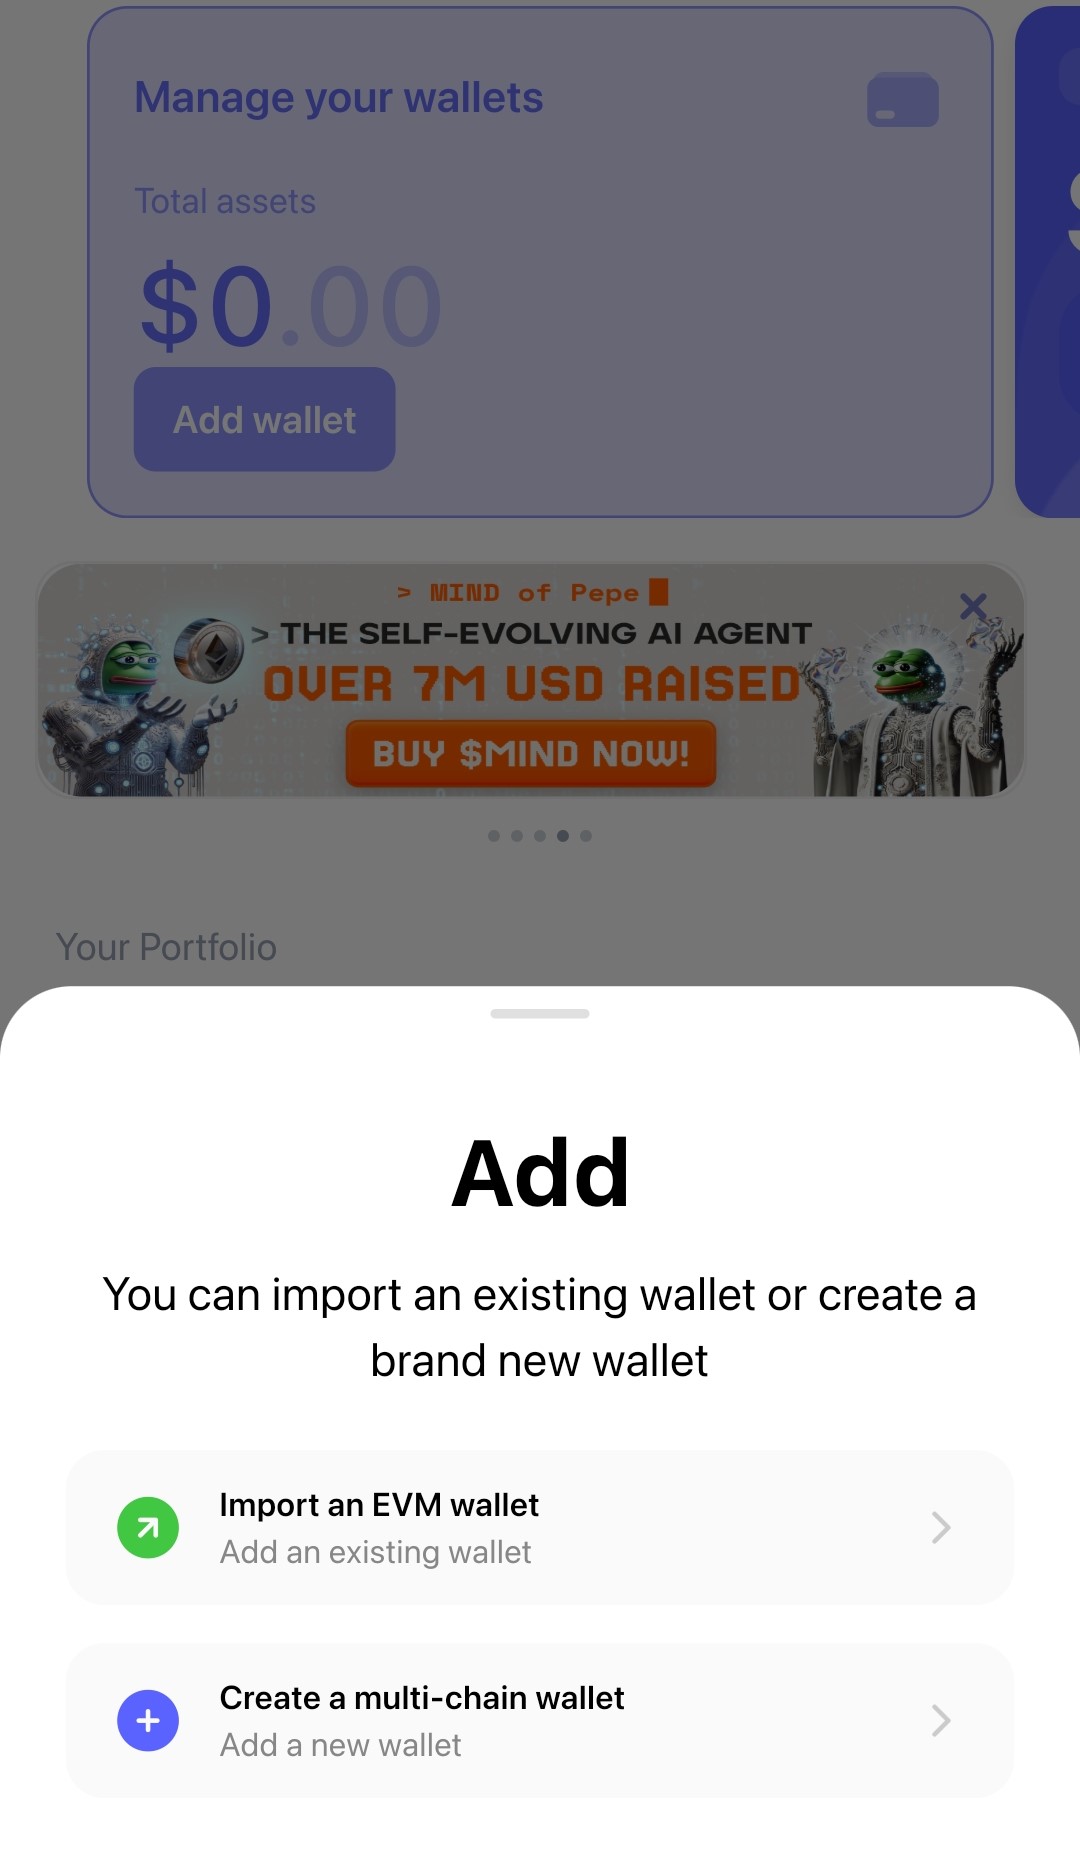
While Best Wallet creates your multi-chain wallet automatically, you can add additional wallets anytime from the Home tab.
1. Swipe right on your current wallet and tap on ‘Add Wallet’.
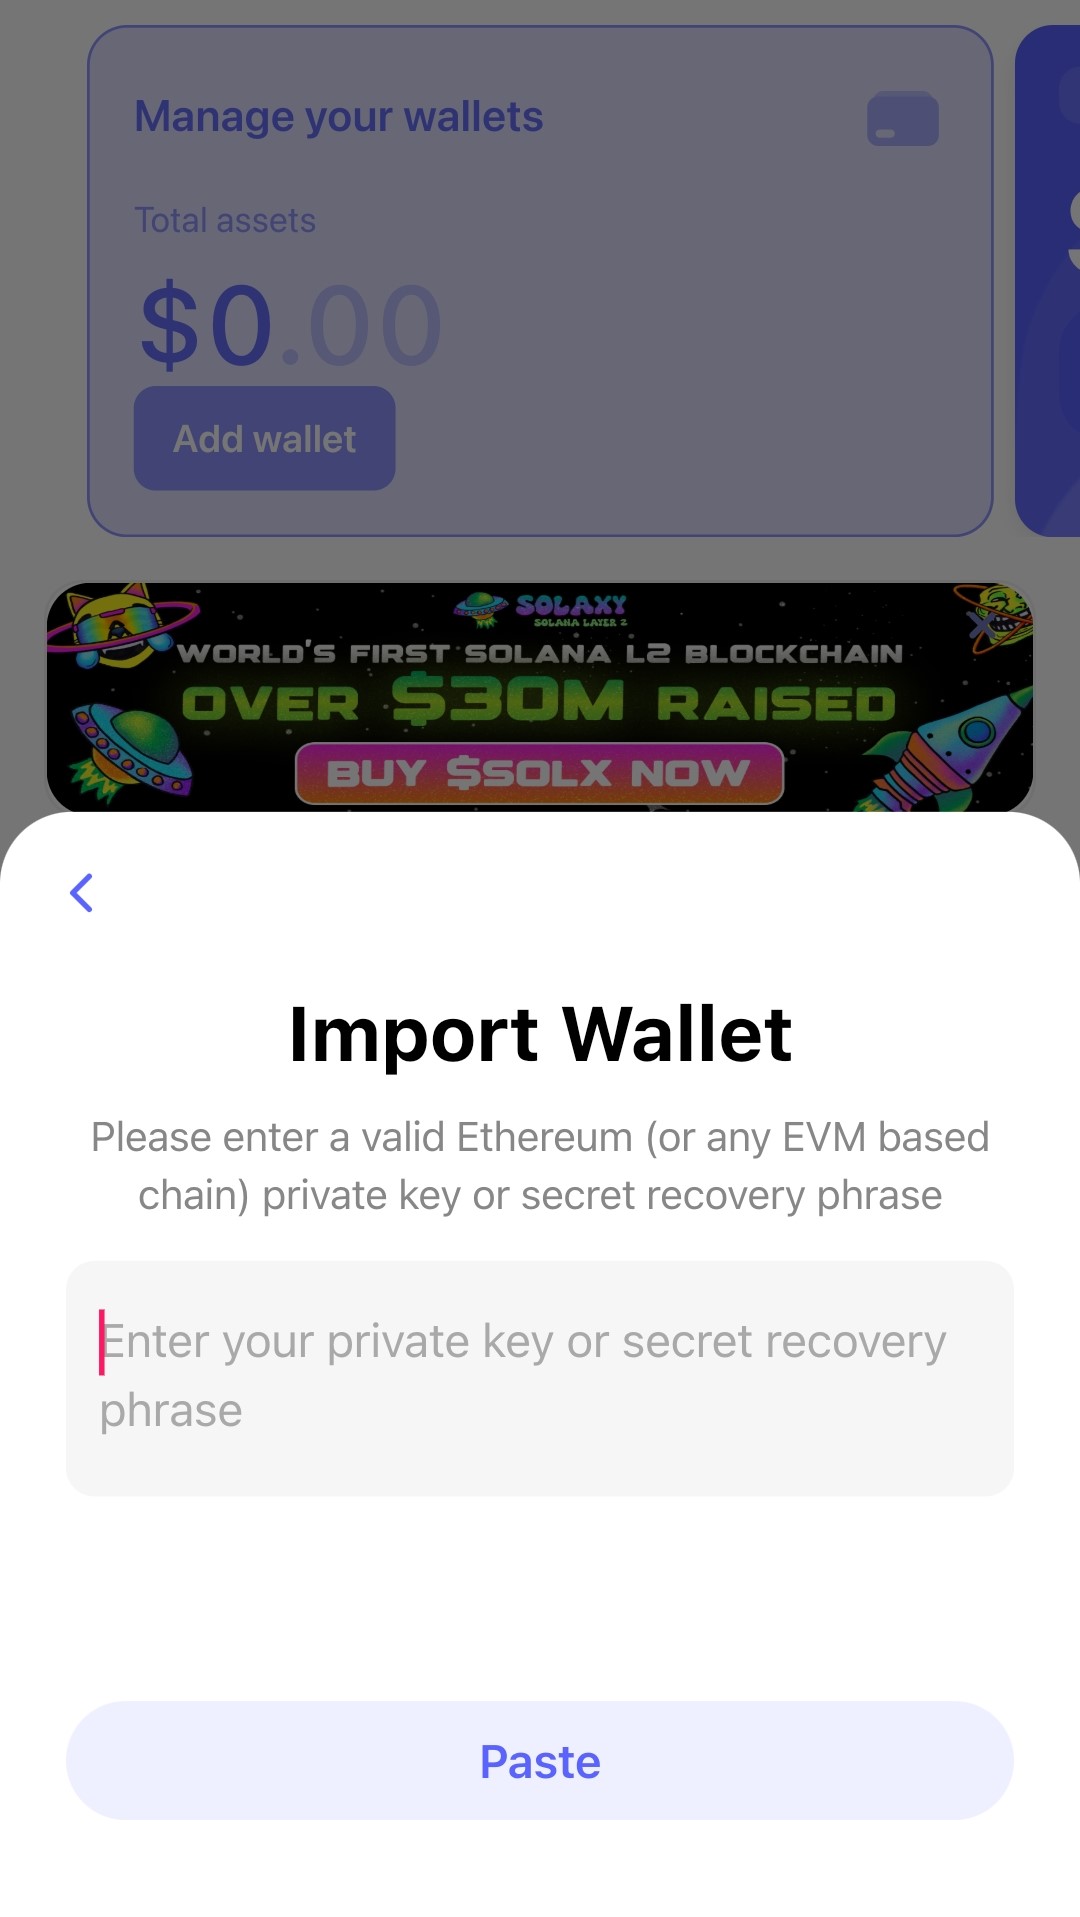
2. Import an existing EVM wallet by entering its recovery phrase, or create a brand new multi-chain wallet.
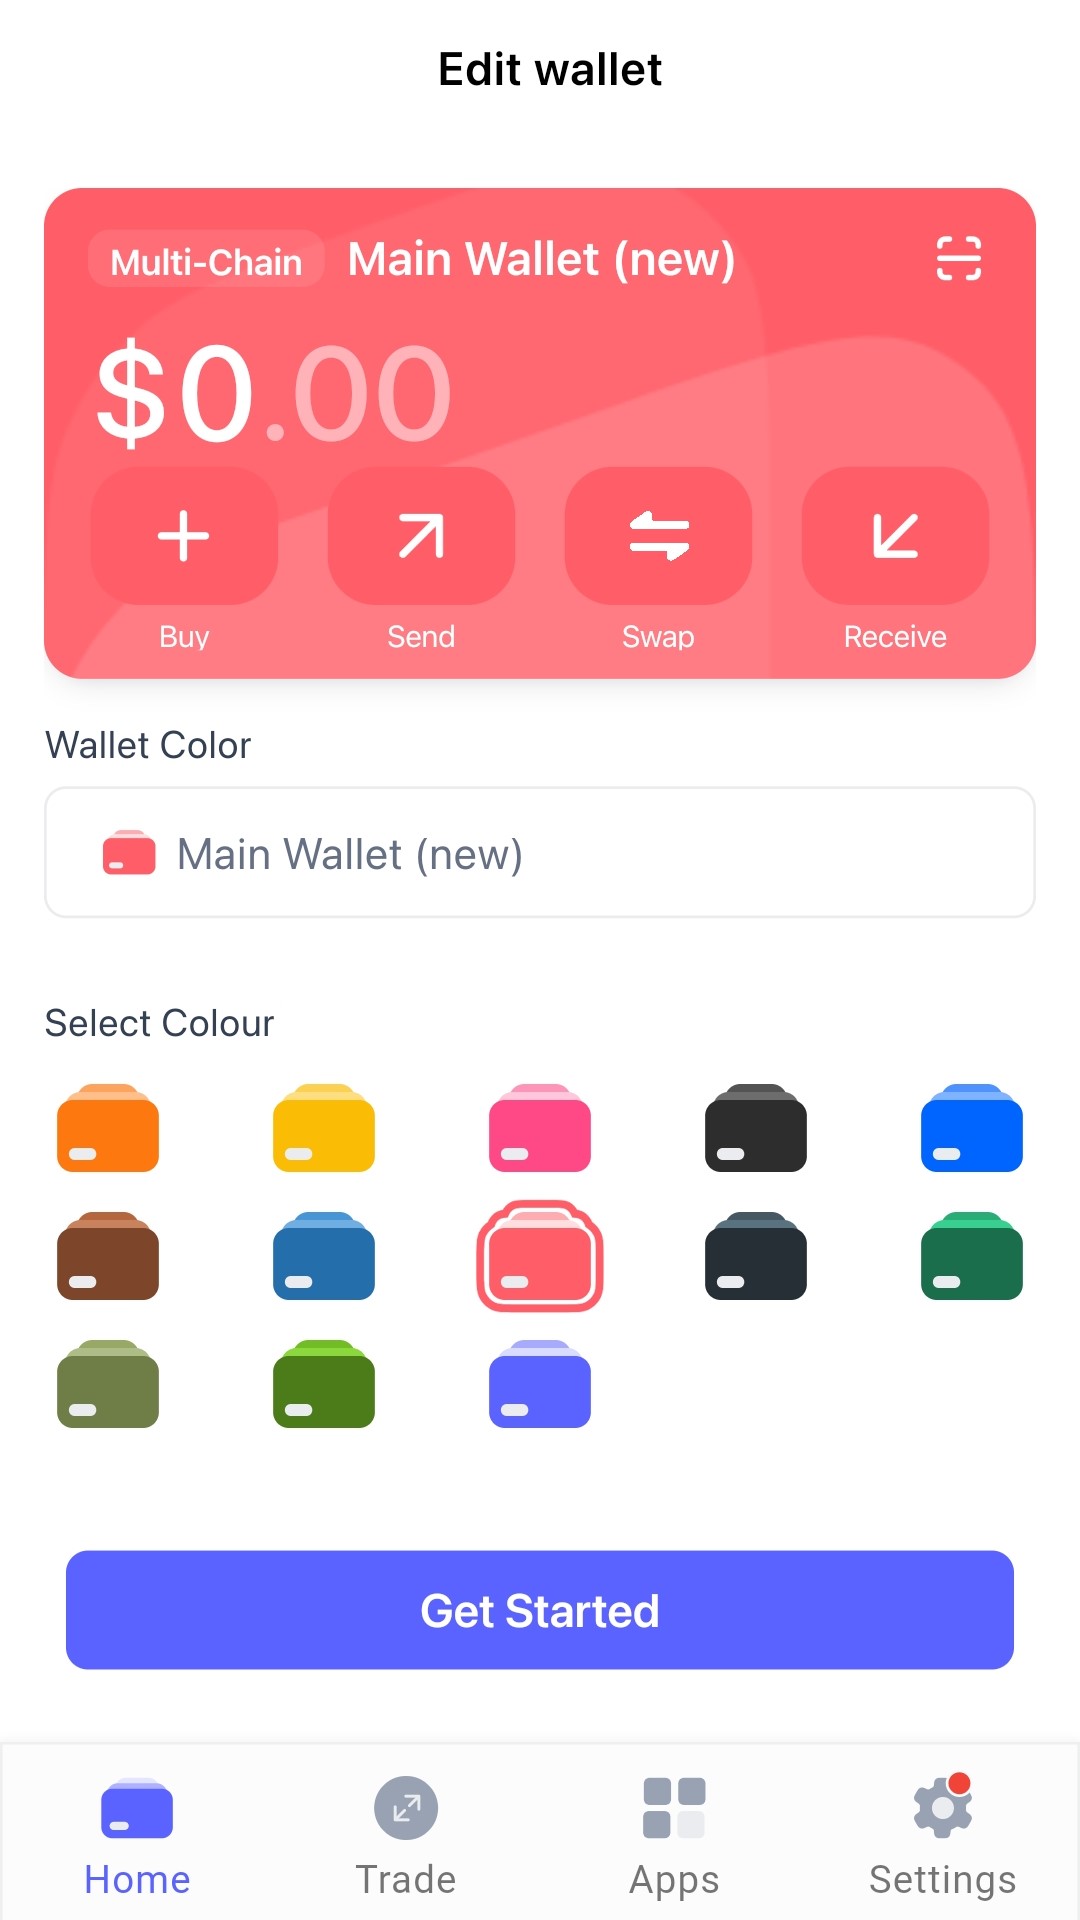
3. Rename the wallet as you like and complete the setup. This newly added wallet will become your default.
ICO Drops – Conclusion
Investing in ICOs can set you up to profit from subsequent bull markets. Notwithstanding, you must thoroughly review the ICO drops before purchasing the tokens. We’ve provided the best drops to give you a head start in 2024.
Purchasing these tokens will always come with risks. ICOs are less regulated than IDOs and IEOs. Hence, they are more open to scams and large-scale project failures.
Besides holding your tokens for profits, some projects, like Dogeverse, introduce staking rewards and annual percentage yields. These are extra ways to gain from ICO investing.
Only invest the amount that won’t leave a dent in your financial capacity to cater to other essential needs. Study current market situations to know when to prepare for short- or long-term crypto holds.
FAQs
Should you invest in ICO drops?
You should invest in ICO drops for the most affordable entry into new crypto projects. Nonetheless, investigate the authenticity of any crypto project and its technological feasibility before investing.
What is the best site to find ICO drops?
The best site to find ICOs is icobench.com. It offers comprehensive information, expert ratings, and detailed analysis of various ICO projects, making it an invaluable resource for investors and enthusiasts alike.
Is investing in ICOs profitable?
Subsequent bull runs and annual percentage yields from staking can bring substantial profit. Those are in addition to the regular trades you can make on public exchanges.
Which ICO is trustworthy?
ICOs often provide audit details to prove the validity of their smart contracts. They can also come from teams that have developed successful projects.
What is the alternative to ICO drops?
The best alternatives to ICO drops, are coins which can already be traded on decentralised and centralised exchanges. The benefit of investing in those coins is that they may already have a larger community and ready product, whereas the benefit of ICO drops is their higher revenue potential due to buying before they come to market.
Jeremiah is a seasoned content writer with a knack for all things SEO, especially in the realm of cryptocurrency. He loves diving deep into the world of blockchain to create engaging content that not only informs but also entertains. Apart from writing, Jeremiah enjoys reading, playing casino games, and of course, music!
We use cookies to ensure that we give you the best experience on our website. If you continue to use this site we will assume that you are happy with it.I AcceptPrivacy policy