




 Some of the links on this site may be affiliate links. ICOBench may receive advertising commissions when users visit recommended platforms via our affiliate links, at no additional cost to you. All recommendations are based on a comprehensive review process.
XRP News: XRP price rose 2.87% during the July 6 session, climbing from $1.1344 to a high of $1.1594 before sellers forced a pullback toward $1.146, a move that cleared the $1.14 resistance level on volume of 81.89 million XRP, approximately 207% above the 24-hour average, and immediately converted that breakout into a support test against the 200-day moving average cluster that defines the $1.10–$1.15 zone as the structural battleground for the next directional leg.
The breakout itself arrived at 22:00 UTC on July 5, carrying XRP through a level that had capped repeated rallies throughout June 2026, but the failure to hold above $1.155 on the session close introduced a binary setup that keeps the broader technical picture unresolved.
The open question the market must now resolve is whether a sustained daily close above the moving average cluster opens the path to $1.18–$1.35, or whether a failure at current levels risks a slide back toward $1.00 and the $0.85–$0.90 demand zone below.
XRP News: What the 207% Volume Spike and $1.14 Breakout Actually Reveal About Structural Risk
Context significantly enhances the raw figures. The $1.14 level is not simply a round number that sellers happened to defend; it sits at the upper boundary of a 200-day moving average cluster that stretches across the $1.10–$1.15 band, a zone that the Bitcoin Foundation describes as the area XRP must “reclaim and maintain above on a daily closing basis to put the current bearish structure at risk.”
Every prior rally attempt since late Q2 2026 has faded before converting this cluster from resistance into durable support, making the July 5 volume breakout the most significant test of that structural thesis in months.
The 60-minute chart weakened after XRP failed to reclaim $1.155, tightening the range between $1.145 and $1.151. Analysts places the immediate resistance at $1.16, with supports stacked at $1.13, $1.11, and $1.08, a tiered structure that confirms how little margin exists between the current price and the next meaningful downside zone.
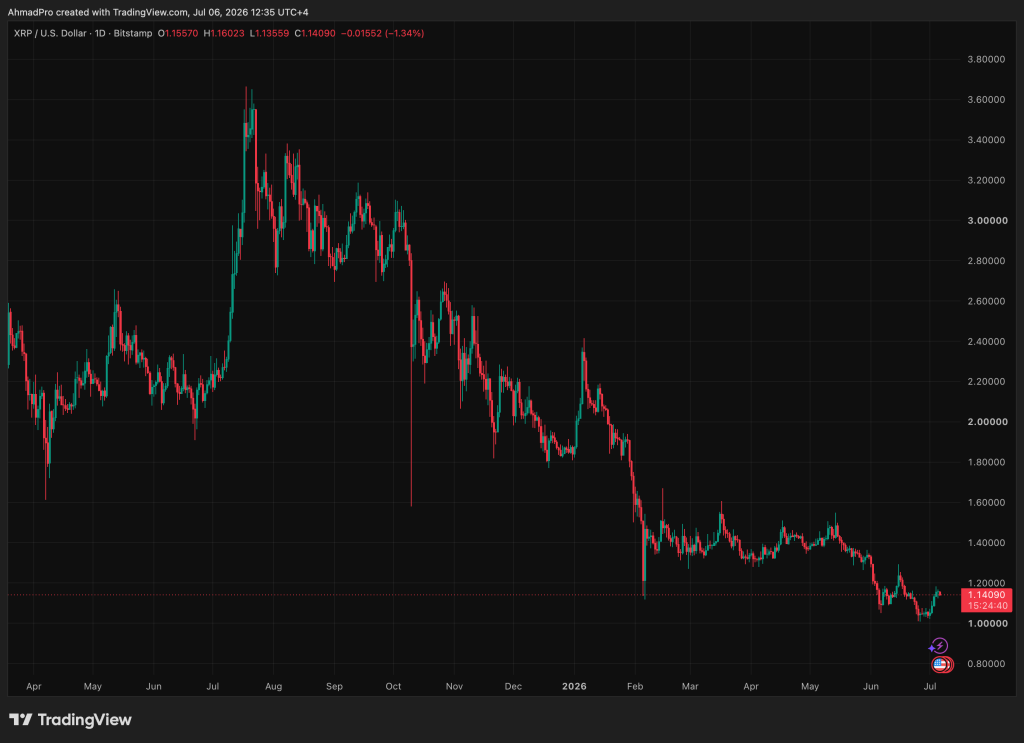
The 4-hour timeframe shows a downtrend break and bullish divergence consistent with a potential Elliott Wave advance, per multiple technical analysts covering the setup, but those signals carry weight only if the $1.1400–$1.145 support zone absorbs the current retest on a closing basis.
AltIndex’s technical note confirms that the 50-day moving average remains above the 200-day moving average for XRP, with MACD staying constructive, a bullish alignment that reinforces the broader setup without resolving the immediate support test.
A decisive loss of $1.145 on volume would weaken the breakout, shift focus toward $1.133 as tertiary support, and reopen the downside path toward $1.06, where MEXC identifies a URPD and Fibonacci 0.786 cluster as “the number that likely settles it.”
As MEXC stated directly: “Hold that level, and $1.27 and $1.35 come into view. Lose it, and $0.80 or lower becomes the more likely path.” That is the range of outcomes the current $1.14 test is adjudicating.