




 Some of the links on this site may be affiliate links. ICOBench may receive advertising commissions when users visit recommended platforms via our affiliate links, at no additional cost to you. All recommendations are based on a comprehensive review process.
In XRP news today, Ripple’s XRP is trading near $1.09 – roughly 72% below its all-time high – with its monthly RSI having breached levels never recorded in the token’s 13-year trading history, falling below 42, 41, and even 40 in a move that exceeds the extreme reached during the March 2020 COVID crash.
XRP posted a 6.83% gain in July, one of its stronger monthly closes on record, yet spot ETF products recorded zero flows on 11 of 17 trading days across the same period, this news exposing a stark decoupling between price stabilization and institutional conviction.
The open question the market must now resolve is whether the most extreme oversold monthly RSI in XRP history marks a genuine generational bottom, or whether the absence of institutional follow-through means lower prices – and potentially Gaussian channel support at $0.88 – arrive first.
Monthly RSI at Historic Lows: What the Most Oversold Reading in XRP History Actually Reveals About the Bottom Formation Thesis
Analyst EGRAG CRYPTO (@egragcrypto) published a detailed monthly RSI breakdown on July 1, 2026, declaring that the 1-2-3 RSI bottom model he had previously tracked has officially failed. Per EGRAG CRYPTO’s analysis, XRP’s monthly RSI broke beneath three successive historical support zones, 42, 41, and 40, before beginning to flatten near the 40 region, a level that now marks the lowest monthly RSI reading across the asset’s entire chart history.
The Binance Square breakdown from The Crypto Basic confirms the June 2026 monthly RSI closed at 40.59, below the 43.75 recorded during the March 2020 COVID collapse and the 43.91 from the June 2022 Terra-driven selloff.
What makes this reading structurally notable is not just its rarity, deeply oversold monthly RSI conditions have appeared only four times in XRP’s history – but the observation that price does not necessarily need to bottom before momentum begins improving.
#XRP Monthly RSI Update 👀:
The 1-2-3 RSI bottom model has officially failed.
Instead, #XRP has done something even more interesting… It has entered the most oversold Monthly RSI in its history, breaking below 42, 41, and even 40.
👉Now the RSI is flattening. This is where… pic.twitter.com/FQdTkDuCDX
— EGRAG CRYPTO (@egragcrypto) July 1, 2026
EGRAG CRYPTO noted that price could still print a lower low while the RSI forms a higher low, creating the conditions for a powerful bullish divergence. That caveat is central to reading this signal correctly: extreme oversold does not equal immediate reversal, and the RSI’s current flattening near 40 is a stabilization signal, not yet a confirmation.
The RSI recovery roadmap EGRAG CRYPTO outlined runs in stages: reclaim 40, then 42, followed by 46.5 and 47.8, and eventually a break above 50. That last threshold carries particular weight – the previous decisive move above 50 on the monthly timeframe coincided with XRP’s 500% surge in late 2024.
For traders already tracking XRP’s macro headwinds through 2026, the monthly RSI context reframes the bearish narrative as a potential coiled spring rather than a structurally broken asset.
XRP News And Price Analysis: What the Gaussian Channel and $1.01 Line-in-the-Sand Actually Reveal About the Real Bottom Risk
Three price levels define the technical structure around XRP’s current position. The most immediate is $1.01, which functions as the line in the sand separating a controlled consolidation from an accelerated breakdown – losing this level on a daily close opens the path to the next meaningful support zone.
The breakout confirmation threshold sits at $1.22: a genuine three-day close above that level, not an intraday wick, is the condition EGRAG CRYPTO’s framework requires to validate the oversold RSI as a launchpad rather than a warning.
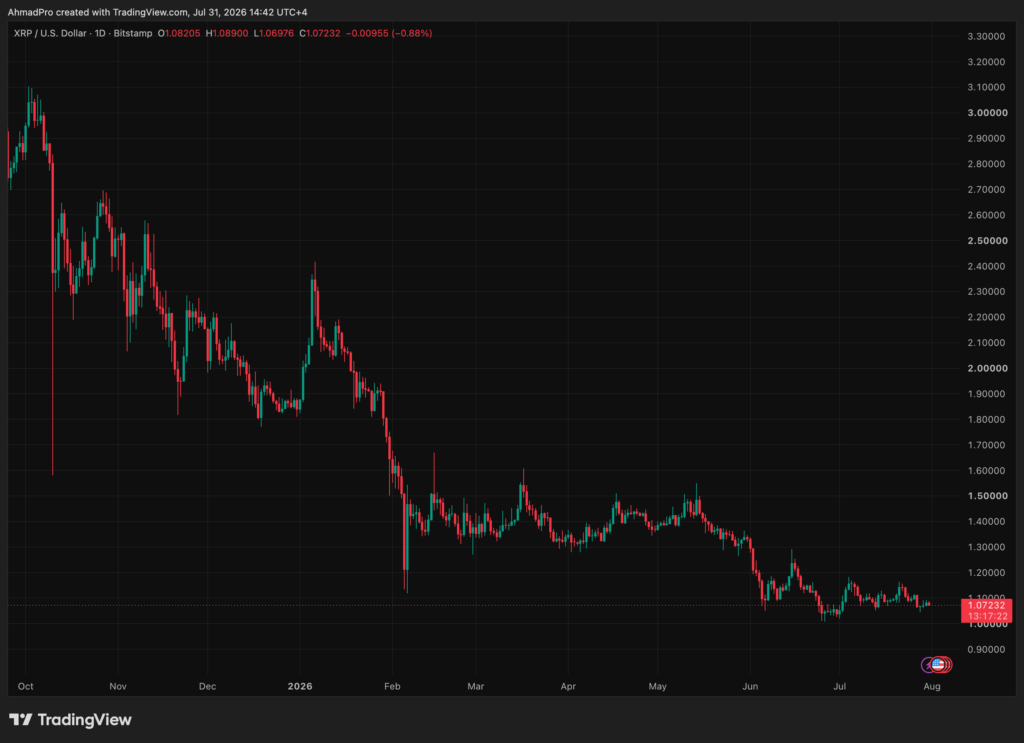
The deeper downside scenario anchors to the Gaussian channel, where support currently sits near $0.88. Per the pre-research analysis citing ChartNerdTA, XRP has been interacting with the middle regression band of its Gaussian channel, a zone that preceded extended accumulation in prior cycles, and a decline below $1.00 would align RSI positioning with genuine historical macro bottom structures.
The Gaussian channel floor at $0.88 is dynamic and gradually rising, meaning time itself reduces the risk of that level being tested, but it remains the structural backstop if $1.01 fails.
For context on how closely these downside targets align with prior bearish projections, earlier XRP technical analysis had flagged $1.07 as a critical support threshold, a level XRP has since tested and briefly undercut.
The current setup is therefore a direct continuation of a bearish pressure pattern that has been compressing since XRP’s October 2025 peak near $2.84, with each technical support giving way and the next level becoming the new battleground.