

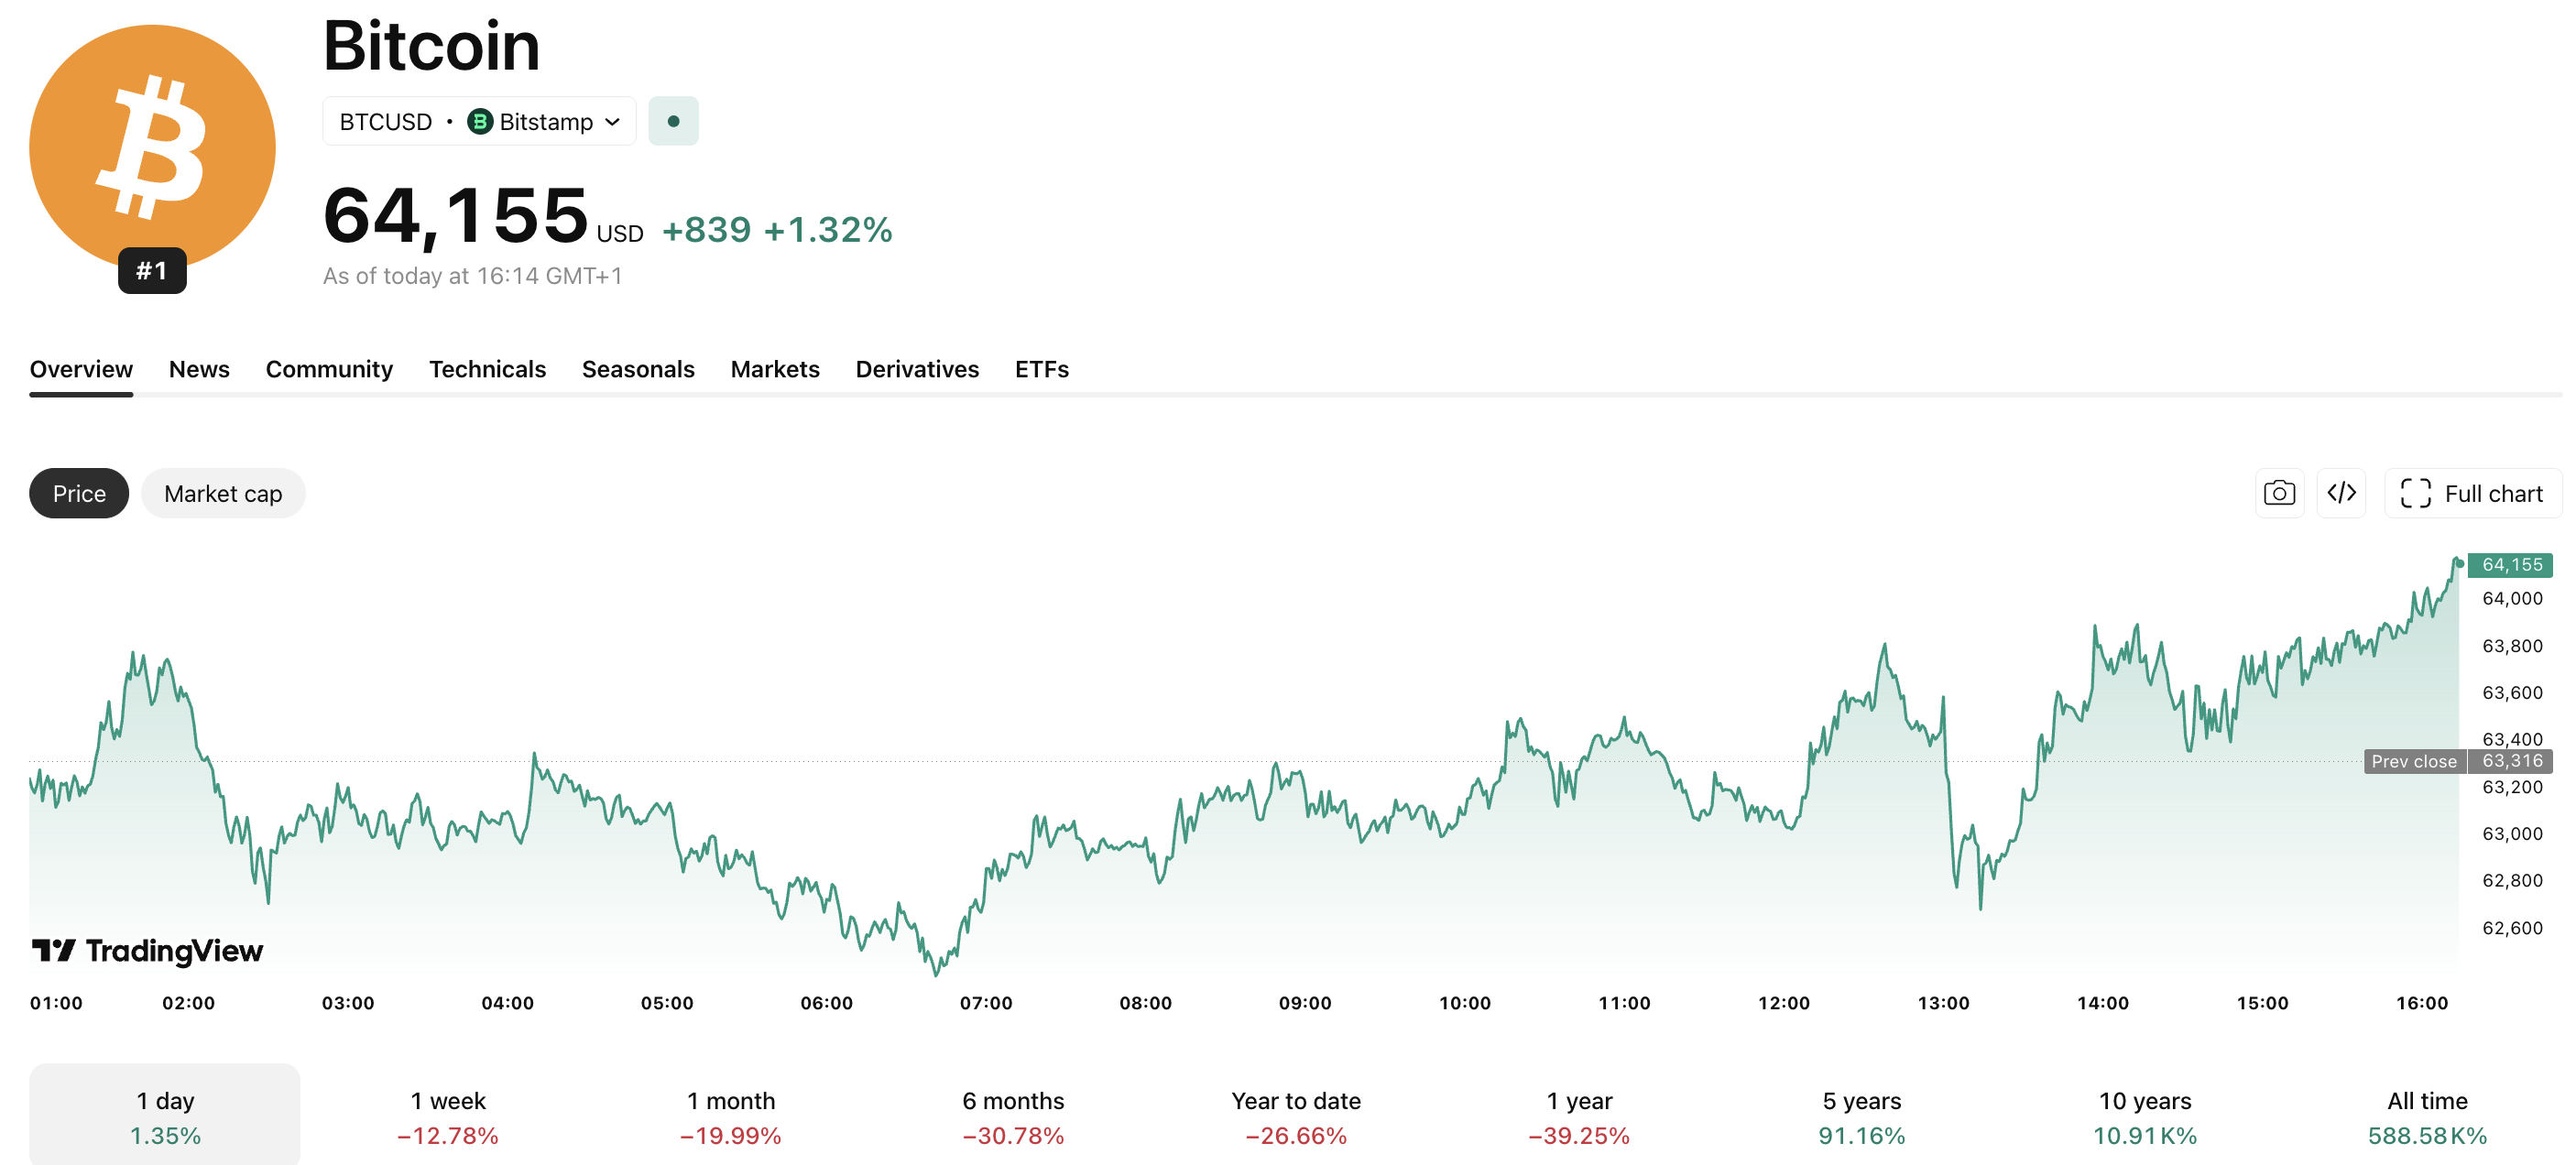
Bitcoin recovered 1.5% to $63,053 on Monday, June 8, but that fractional bounce does nothing to obscure the severity of what just happened: an 18% weekly collapse, the worst single-week performance of 2026, accompanied by $1.72Bn in US spot ETF outflows, the largest weekly redemption wave since April 2025.
The damage compounds across a 13-day consecutive outflow streak that has now drained approximately $4.4Bn from ETF products and, crucially, has flipped 2026 year-to-date ETF flows negative for the first time since these instruments launched in January 2024.
June 8 Update:#Bitcoin ETFs:
1D NetFlow: -4,889 $BTC(-$311.86M)🔴
7D NetFlow: -26,077 $BTC(-$1.66B)🔴#Ethereum ETFs:
1D NetFlow: -8,426 $ETH(-$14.2M)🔴
7D NetFlow: -97,515 $ETH(-$164.31M)🔴https://t.co/1ceqfZIdnG pic.twitter.com/eyeVLK0K6v— Lookonchain (@lookonchain) June 8, 2026
That structural milestone, the first YTD flow reversal in the ETF era, is not a short-term noise event. It marks the moment the institutional tailwind that powered BTC from sub-$50,000 in early 2024 to an all-time high above $126,000 in October 2025 has, at least temporarily, reversed polarity.
The open question the market must now resolve is whether the $63K zone represents a durable accumulation floor where forced selling exhausts itself against long-term holders, or the upper boundary of a deeper structural breakdown that targets the $55,000–$58,000 range as the next meaningful support cluster.
DISCOVER: How the $4.4B ETF Outflow Streak Is Reshaping the Crypto Landscape
Bitcoin ETF Outflows: What the $1.72Bn Weekly Exodus Actually Reveals About Institutional Positioning
Context enhances outflow figures significantly. When ETF shares are redeemed, the issuing fund must liquidate its underlying BTC holdings, creating real-time selling pressure in spot markets. Recent data show that $1.72Bn was redeemed in one week, contributing to a total of $ 5.4Bn over four weeks, marking a substantial structural unwind from the peak of approximately $ 104Bn in ETF assets.
BlackRock’s IBIT, the largest US spot Bitcoin ETF, recorded a single-session outflow of $342.34M, a record high. Total ETF BTC holdings have dropped to around 1.277 million BTC, about 7.2% below the October 2025 peak.
Galaxy Research describes the current outflow as a “real directional recalibration” driven by three main sources: hawkish Federal Reserve signals, escalating geopolitical risks, and institutional capital shifting towards AI-related equities. This suggests outflows are partly offensive, with capital being actively redeployed rather than waiting on the sidelines.
Historically, a drop in daily redemption volumes at the end of an outflow streak has indicated stabilization. While cumulative net inflows since the ETF’s launch remain positive, the current negative year-to-date flow is unprecedented, occurring without the typical conditions of declining rates or easing geopolitical tensions seen in prior stabilization episodes.
DISCOVER: Best Meme Coins to Buy Right Now
Why Bitcoin Failed as a Safe Haven During the Iran-Israel Escalation
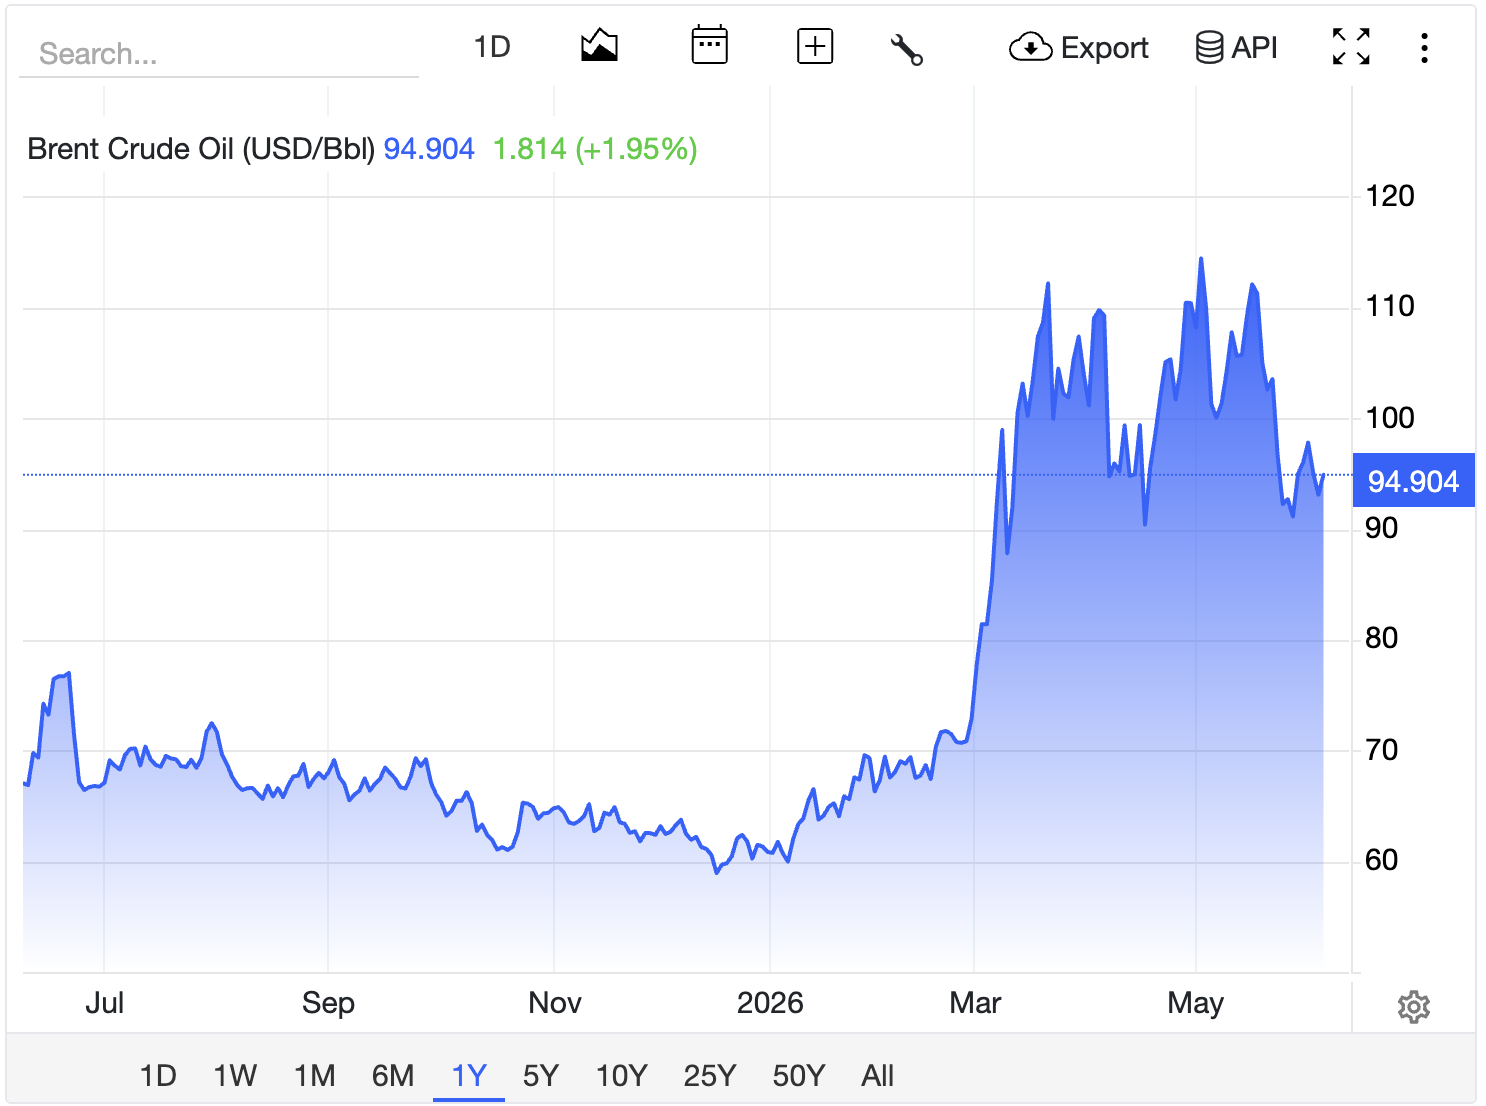
This week’s market turbulence is driven by geopolitical tensions, particularly the exchange of airstrikes between Iran and Israel, leading to a 5% rise in Brent crude prices to around $97.78 and WTI to $94.83.
This rise in oil prices pressures inflation expectations, making it harder for the Federal Reserve to cut rates. Strong US nonfarm payrolls data further complicates the situation, giving the Fed more leeway to increase rates, which adversely affects speculative assets like crypto.
Bitcoin is particularly vulnerable as its safe-haven appeal has diminished during this geopolitical crisis. In previous conflicts, capital sometimes flowed into Bitcoin as a non-sovereign asset, but that’s not happening now due to inflationary pressures and a shift in focus to AI equities.
This is evidenced by a negative shift in ETF flows. Currently, Bitcoin is more correlated with risk assets than it is independent of them.
Bitcoin Price Structure: The Levels That Define What Happens Next
Spot is still supporting $BTC move here.
Late shorts are also getting wiped out.
As long as spot demand stays, Bitcoin will continue its short-term uptrend. pic.twitter.com/f5SmYwhivH
— Ted (@TedPillows) June 8, 2026
Bitcoin, currently at $63,053, is caught between critical technical levels. The key support lies at the 200-week moving average (MA) near $61,300, which has historically served as a long-term floor during bear cycles.
A sustained close below this level could trigger a significant downturn. Immediate support above the 200-week MA is around $62,000–$63,000, while a breakdown could lead to the $58,000–$59,000 zone, a crucial area for short-term holders.
On the upside, reclaiming resistance in the $64,000–$65,000 range is necessary for a neutral shift, with a decisive close above $68,000 needed for a real recovery.
Bull case: If ETF outflows slow before the June 17 FOMC meeting and the Fed signals dovishness, Bitcoin could reclaim $66,000 and aim for $72,000–$75,000.
Base case: Bitcoin trades within the $61,000–$65,000 range, with ETF flows flat and the 200-week MA holding firm.
Bear case: A close below the 200-week MA activates the $58,000 zone and potentially drops to $55,000, which would invalidate the recovery thesis.
EXPLORE: Next Crypto to Explode in 2026
This article is for informational purposes only and does not constitute financial advice. Crypto assets are highly volatile. Always conduct your own research before investing. Cryptocurrency investments carry significant risk, including the potential loss of principal. Past performance of any asset, ETF product, or presale project is not indicative of future results.