

Solana’s on-chain activity reportedly accelerated in January, with network fees, transaction counts, and active users all reaching new highs over a 7-day window. SOL traded at $123 at the time of writing, up 1.4% over the past 24 hours and down 3.9 over seven days, reflecting improving sentiment alongside the usage spike. The move comes as broader crypto markets remain range-bound, with Bitcoin consolidating between $86,000 and $90,000 amid historically tight volatility.
The combination of rising network utilization and modest price appreciation places Solana at the center of the layer-1 competition narrative, particularly as traders look for ecosystems showing organic demand rather than purely speculative flows. However, whether higher usage can translate into sustained price momentum remains an open question for market participants.
Against a macro backdrop of cautious risk appetite, Solana’s metrics stand out as one of the few data points showing clear expansion rather than consolidation.
What does the spike in Solana fees and transactions actually signal?
Over the past week, Solana’s daily transaction count reportedly exceeded 60 million, while average daily fees climbed above $4.5 million, levels not seen earlier this year. For traders, this suggests applications are driving activity, not just token transfers.
⚡️ Solana has processed 60M+ transactions every single day for the past 750 days – with zero downtime. https://t.co/OBA9JKjNyG pic.twitter.com/LsdYmLVbXs
— Solana Daily (@solana_daily) January 12, 2026
Active addresses also trended higher, indicating broader participation rather than isolated whale-driven bursts. That expansion strengthens the case that Solana’s throughput advantage is being utilized, a theme echoed in recent discussions around Solana ETF inflows and growing institutional exposure.
Price structure tightens as SOL approaches key resistance
From a technical perspective, SOL is consolidating just below a key resistance zone at $120, a level that previously capped rallies in December. The 14-day RSI sits near 48, signaling slightly negative momentum without entering overbought territory, while the MACD remains above its signal line on the daily chart, supporting the near-term bullish bias.
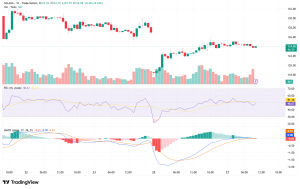
Source: TradingView
SOL continues to trade above its 50-day moving average at $111 and its 200-day moving average near $96, reinforcing the broader uptrend. A confirmed break above $120 could open a path toward $135, while failure to hold $110 would expose downside risk toward the $100 psychological support.
Solana’s activity surge reshapes the layer-1 landscape
Rising usage strengthens Solana’s competitive positioning against Ethereum and other layer-1 networks, particularly for high-frequency and consumer-facing applications. Higher transaction volumes can also improve validator economics, as fee revenue supplements inflation-based rewards, supporting network security over time.
Institutional narratives are beginning to incorporate these fundamentals, as reflected in broader coverage of institutional interest in Solana. For long-term investors, sustained growth in users and fees is more durable than short-lived price rallies.
Where the optimism could break down
The primary risk is sustainability. Past spikes in Solana activity have sometimes been driven by short-term memecoin or NFT booms that faded quickly, leaving fees and users lower weeks later. If current usage proves similarly cyclical, price support above $118 could weaken, invalidating the bullish technical setup.
Additionally, broader market conditions remain a constraint. Bitcoin’s volatility is compressed, with Bollinger Bands at their tightest since July 2025, a setup that often precedes sharp moves in either direction. A downside break in Bitcoin would likely pressure SOL, especially as it trades below its recent year-to-date high of $148.
For now, Solana’s record network activity provides a tangible foundation for a potential rebound from the recent pullback to around $126. Traders should watch whether fees and active users remain elevated into February. Confirmation would strengthen the bullish case toward a retest of $148, while a sharp pullback in on-chain metrics would shift the narrative back toward caution and raise the risk of a deeper decline below $118.
Promising Crypto Presales Gaining Attention
![]()
![]()
![]()