


 Some of the links on this site may be affiliate links. ICOBench may receive advertising commissions when users visit recommended platforms via our affiliate links, at no additional cost to you. All recommendations are based on a comprehensive review process.

Bitcoin broke above $87,000 last week, then slid back toward $83,000. That pullback has split the market into two camps. Is this a healthy reset within a recovery, or an early sign the rally is running out of road?
For now, buyers are holding the line. Bitcoin trades near $84,378, up about 1.2% over 24 hours. Its market cap stands near $1.69 trillion, with daily volume around $32 billion.
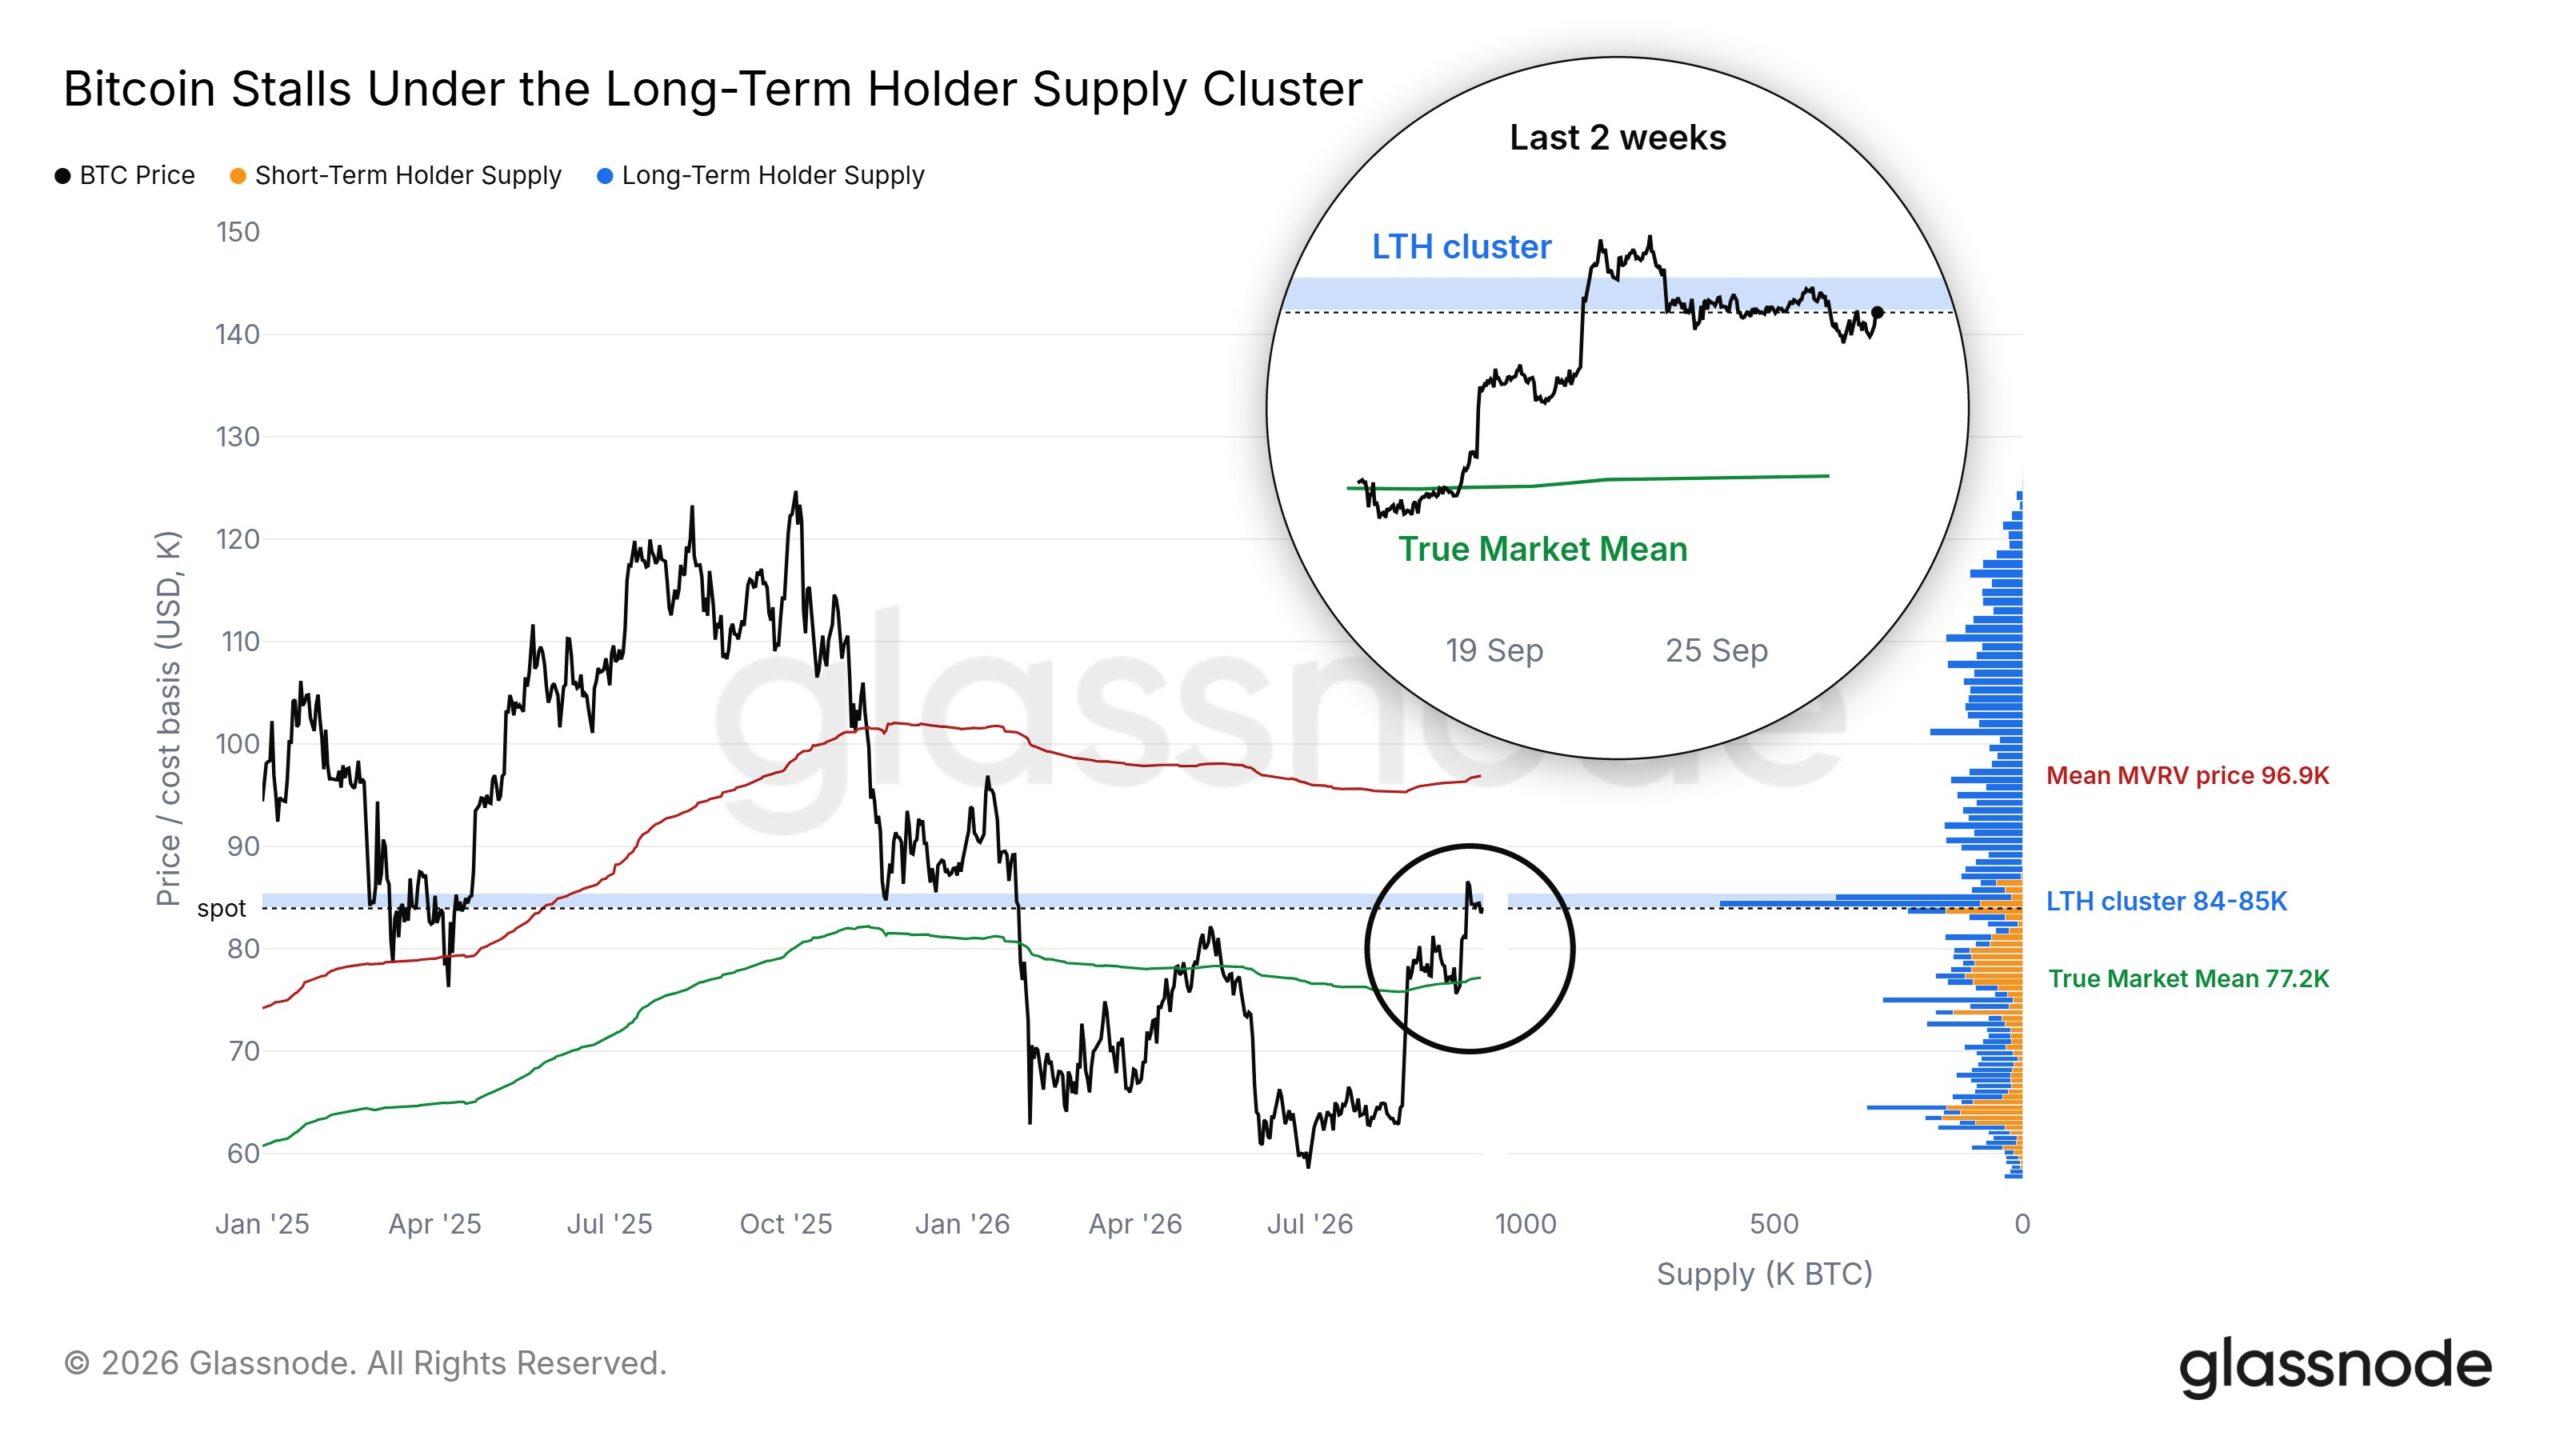
$84K–$85K is the ceiling to beat, $77K is the floor to hold, and a sustained break above the cluster opens the way toward the mid-$90Ks.
Don’t Miss: ETF Experts Predict The Next Crypto to Explode in 2026
Can Bitcoin Hold the $82,500 Confirmation Zone?
The drop from above $87,000 has produced two very different readings of the same move.
The bearish view sees it as a relief rally inside an ongoing bear market, not the start of a true uptrend. HTX chief analyst Cloud disagrees. He argues the drop looks like a normal correction after a recovery, not a failed rebound.
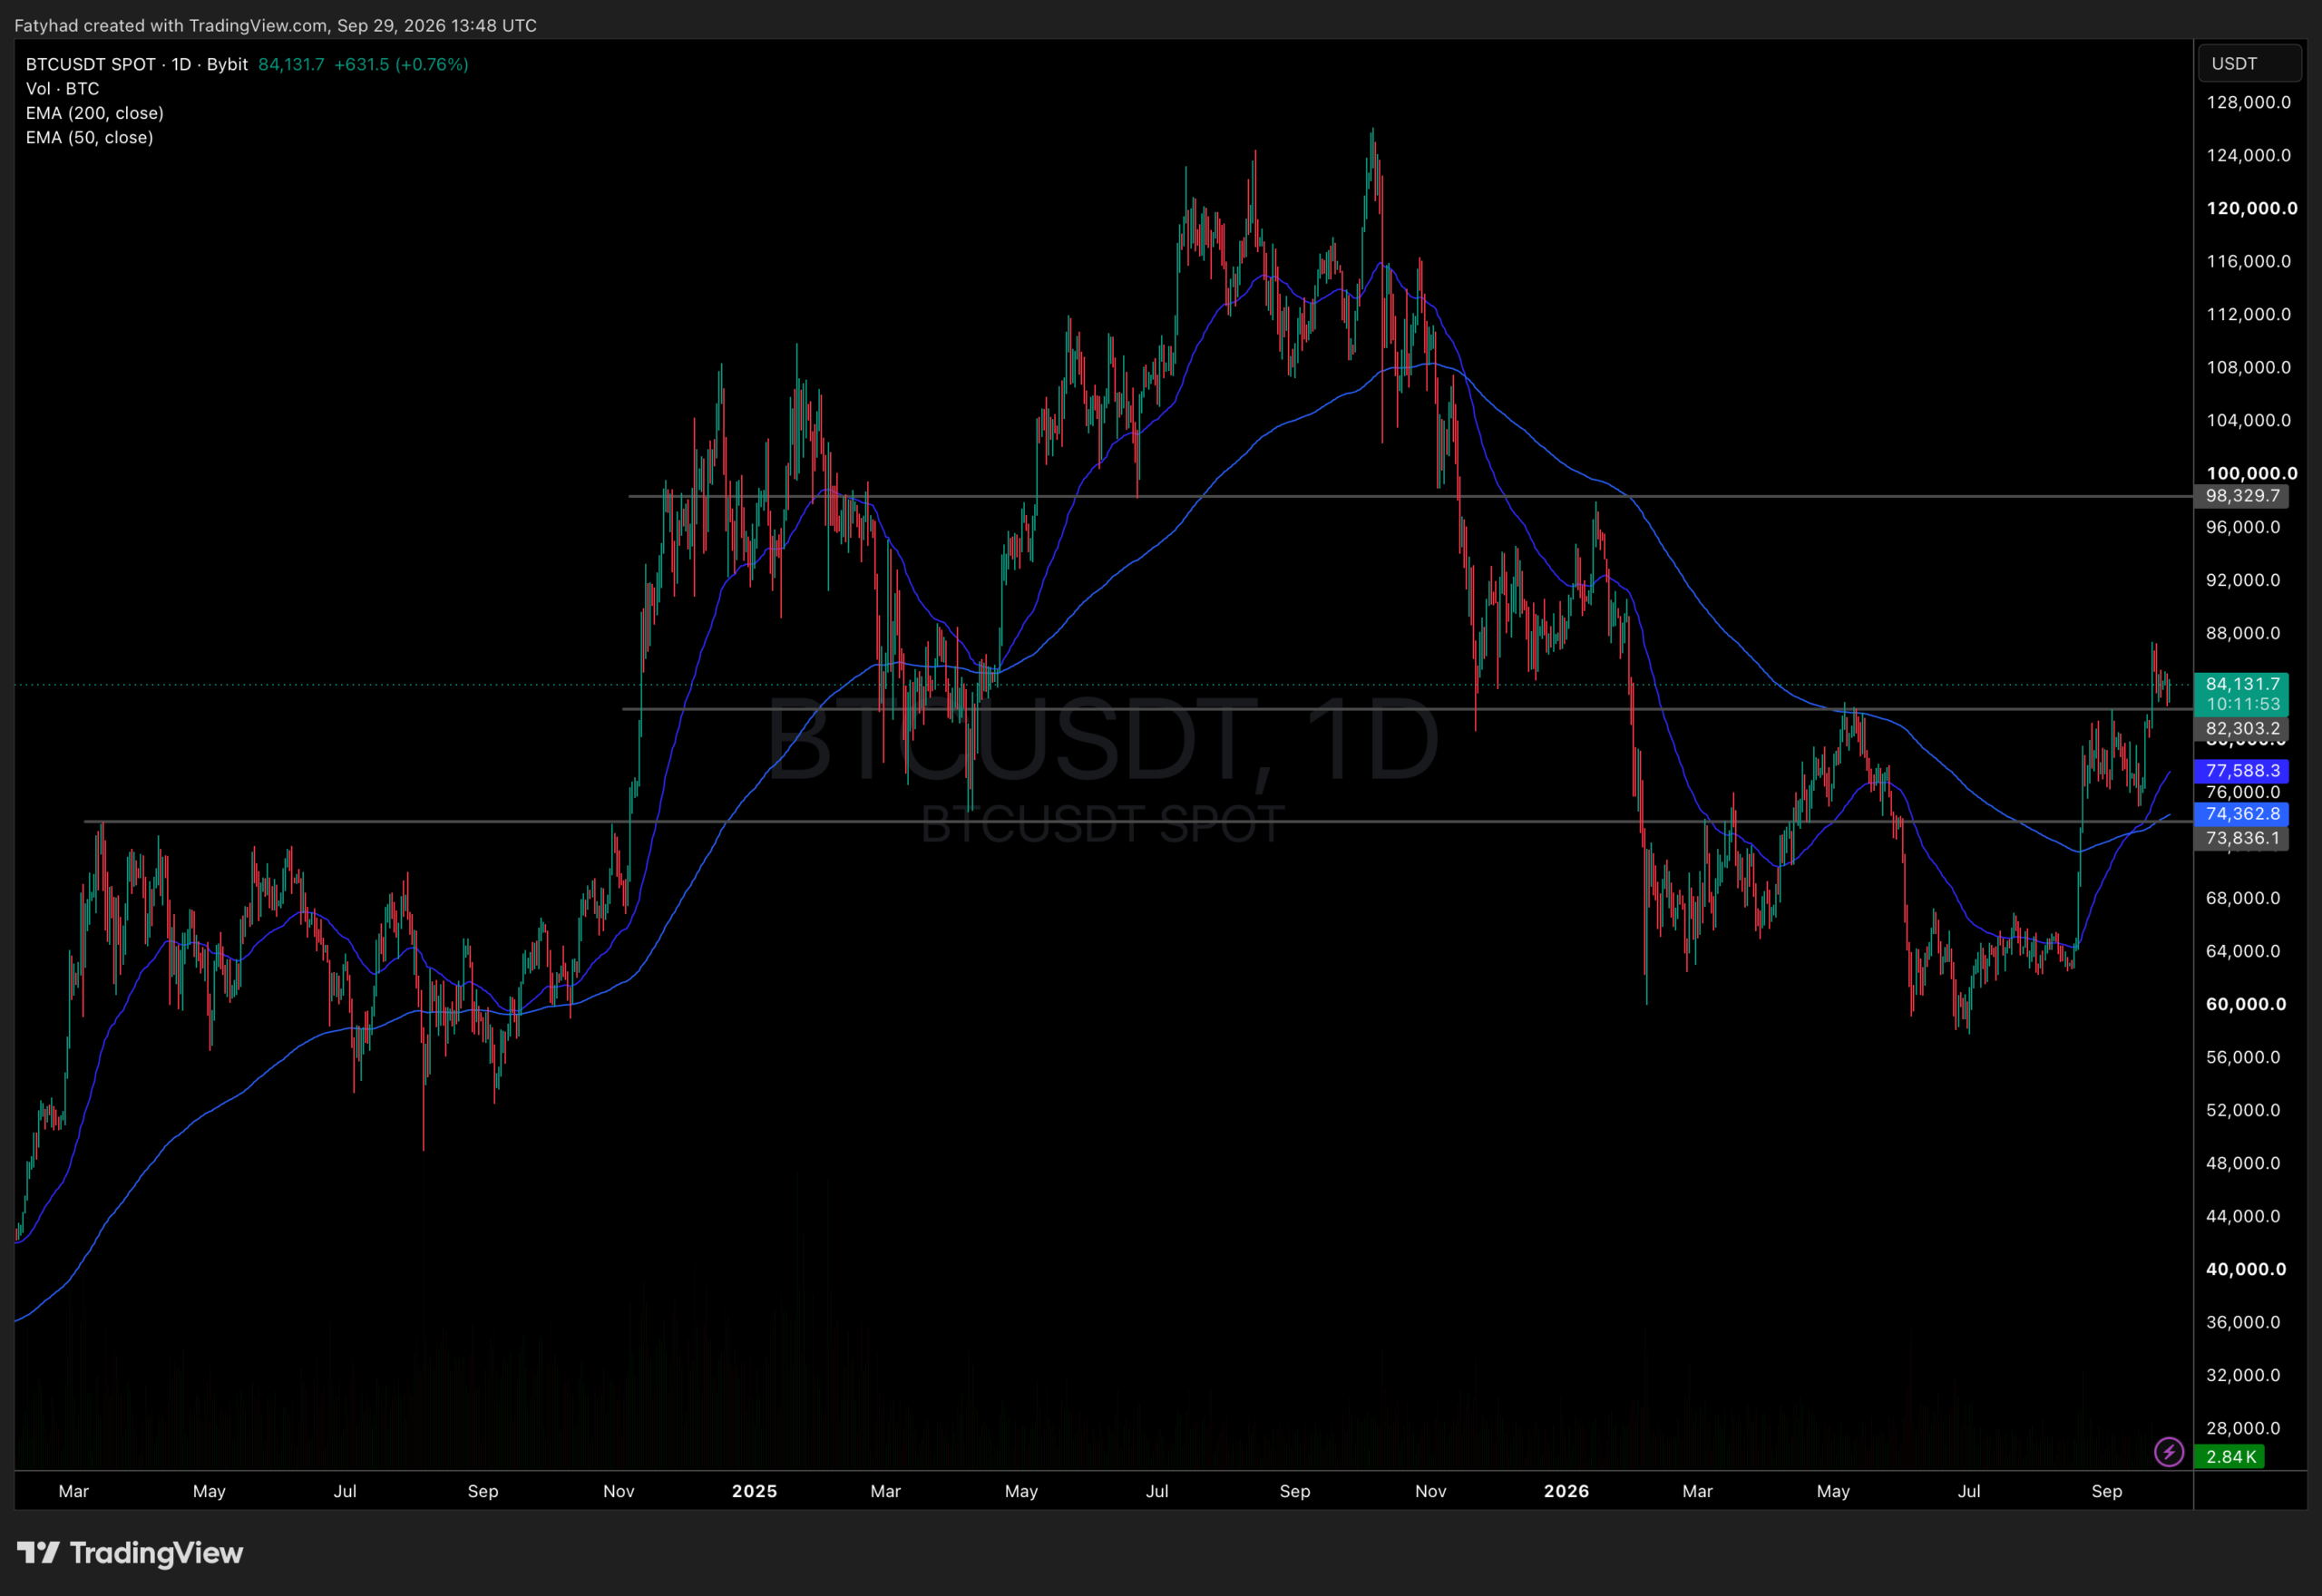
Technical analysis points to a clear line in the sand: $82,000–$82,500. A sustained break below that zone could reopen the $60,000–$80,000 range tested earlier this cycle.
So far, the level has held. Bitcoin dipped to about $82,700 on September 28 before bouncing back above $84,000. The same dynamic played out when Bitcoin first reclaimed $80,000, and again when weekly closes became the key signal of a trend shift, as covered in the closing-level analysis of Bitcoin’s bull-market structure.
Sign Up With MergeX And Trade CryptoWhat Are Options Traders Pricing After the Pullback?
$BTC is rallying on less leverage.
Price is up 35% from the August low, while coin-denominated open interest is down almost 20%.
That puts open interest at its lowest since March, potentially making the rally less susceptible to leverage flushes. pic.twitter.com/dOMjdw3Ljn
— glassnode (@glassnode) September 29, 2026
The derivatives market offers the clearest view of trader sentiment. Put-option block trades now make up roughly one-third of options volume. Traders typically use these to hedge against, or bet on, further declines once a correction begins.
Yet implied volatility on major expiry dates has dropped to around 35%, despite Bitcoin’s fast climb. In other words, traders are protecting against downside but are not pricing in a violent move.
If Bitcoin turns $82,000–$82,500 into firm support on a retest, the setup would resemble the reaccumulation pattern that came before the 2022 recovery. That comparison, however, is still a theory rather than a confirmed signal.
A successful defense would also match the improving ETF picture. Spot Bitcoin ETFs added roughly $2.4 billion last week, supporting Bitcoin’s climb from its 2026 lows.
Could a Break Below $82,000 Revive the Bear Case?
The options data points the other way. Heavy put buying, paired with low implied volatility, suggests traders are positioning for weakness even without expecting a crash.
If Bitcoin loses the $82,000–$82,500 zone decisively, the $60,000–$80,000 range becomes the next area to watch. That outcome is conditional, not guaranteed. This article is not investment advice.
Don’t Miss: ICOBench Experts Call the Next 1000x Crypto Coins for 2027