


 Some of the links on this site may be affiliate links. ICOBench may receive advertising commissions when users visit recommended platforms via our affiliate links, at no additional cost to you. All recommendations are based on a comprehensive review process.
Ethereum (ETH) pushed above $2,730 on September 21, trading around $2,733 and up more than 3% on the day: its highest level in roughly seven months. The session’s range stretched from about $2,646 to $2,745, extending a sharp recovery that began in late summer. Behind the move: easing macro pressure, a return of risk appetite, and a wave of short liquidations as bearish traders were forced to cover. The question for any Ethereum price prediction now is whether ETH can hold this ground long enough to make a real run at $3,000, or whether overhead resistance turns the rally back first.
The breakout matters because it ends a range that had capped ETH since late August. Through that stretch, the token repeatedly found buyers near $2,395 before bouncing, and its failure to clear the upper end of the band kept momentum traders on the sidelines.
Over the past month, ETH has gained nearly 17%, rising from a low near $2,326.
JUST IN 🚨: Ethereum $ETH hits $2,700 for the first time since early February 📈 📈 pic.twitter.com/a8xv1ZZ1SR
— Barchart (@Barchart) September 21, 2026
You’re Still Early: 10 AI Agent Coins That Could Win Big Next Bullrun
What’s Next For Ethereum: $2,800 Resistance and a Rising 200-Day Average
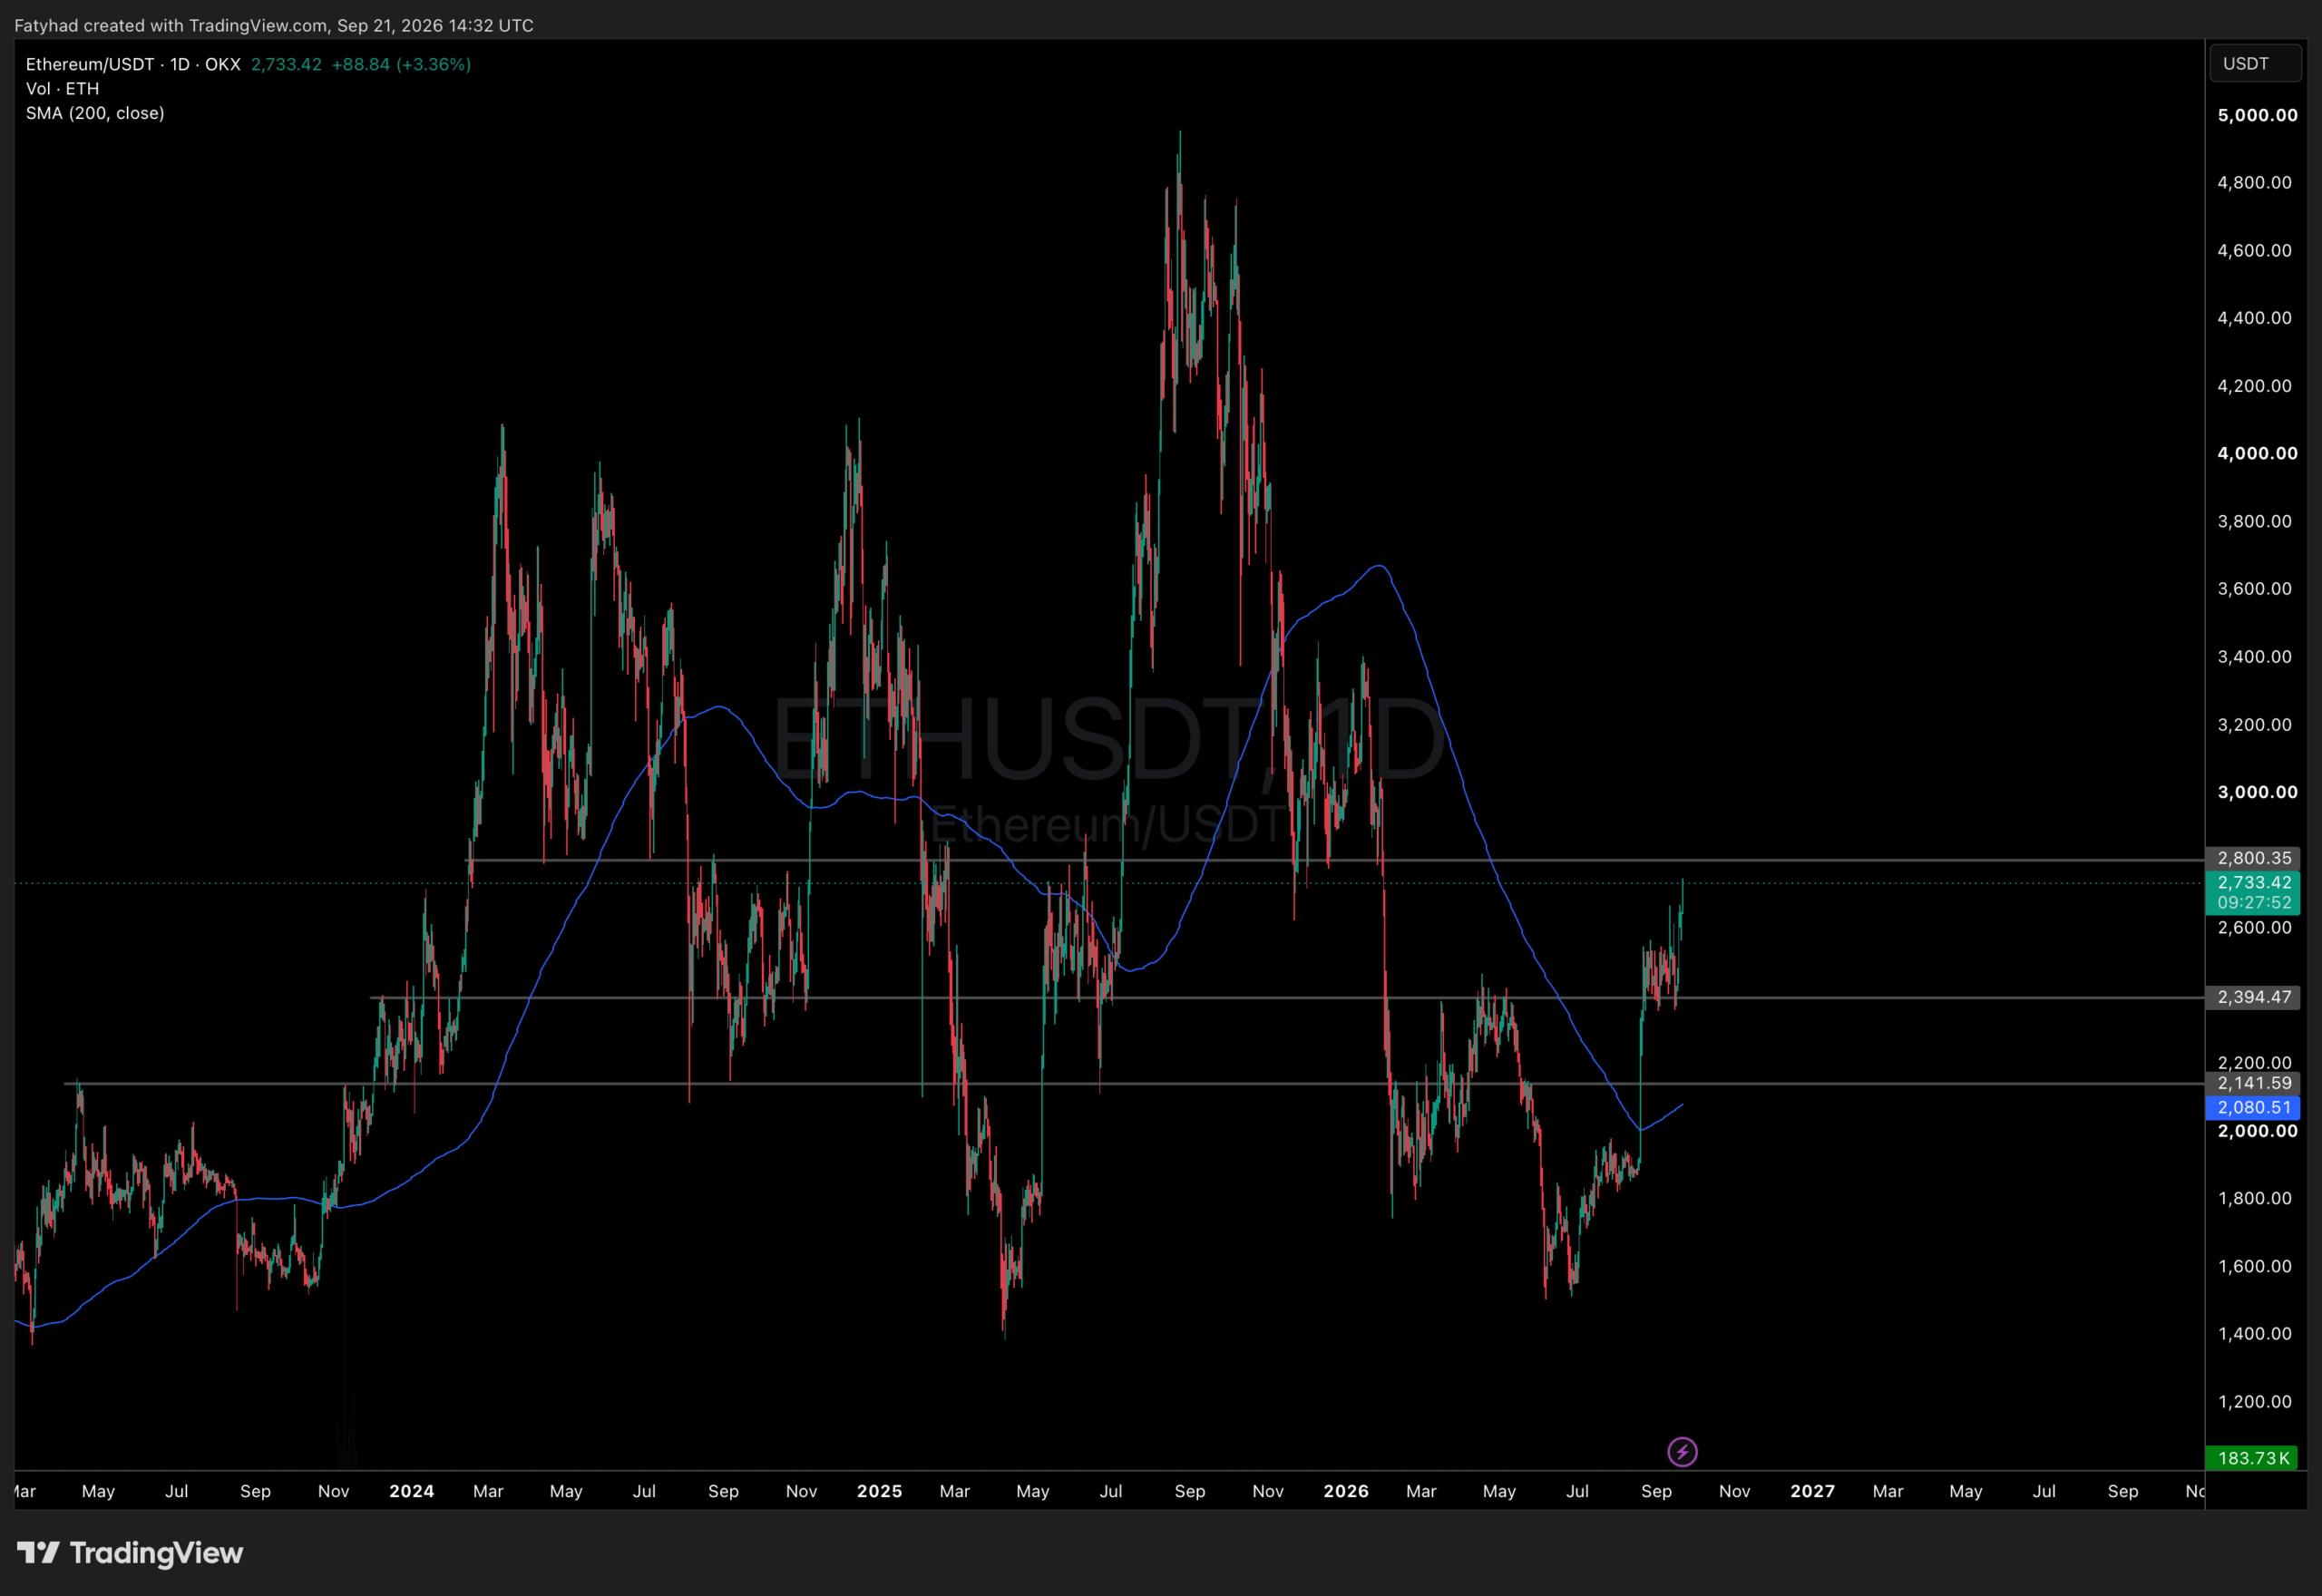
The next major obstacle sits at roughly $2,800. That level acted as support throughout much of 2024 and early 2025 before flipping to resistance after February’s breakdown, making it a natural zone for break-even sellers and profit-taking. It also lines up with the 0.382 Fibonacci retracement of ETH’s decline from its 2025 high near $4,950, reinforcing its importance.
A decisive daily close above $2,800 would open a path toward the $2,950–$3,000 area: the psychological target traders have circled for weeks. The broader trend is also improving: ETH has held well above its 200-day simple moving average (now around $2,080) since breaking over it in August, and the average itself has turned upward after months of decline. That shift typically marks a transition from a bearish to a neutral-to-bullish structure.
Sign Up With MergeX And Trade CryptoLayer 2 Growth, DeFi Expansion and the Rotation Out of Bitcoin
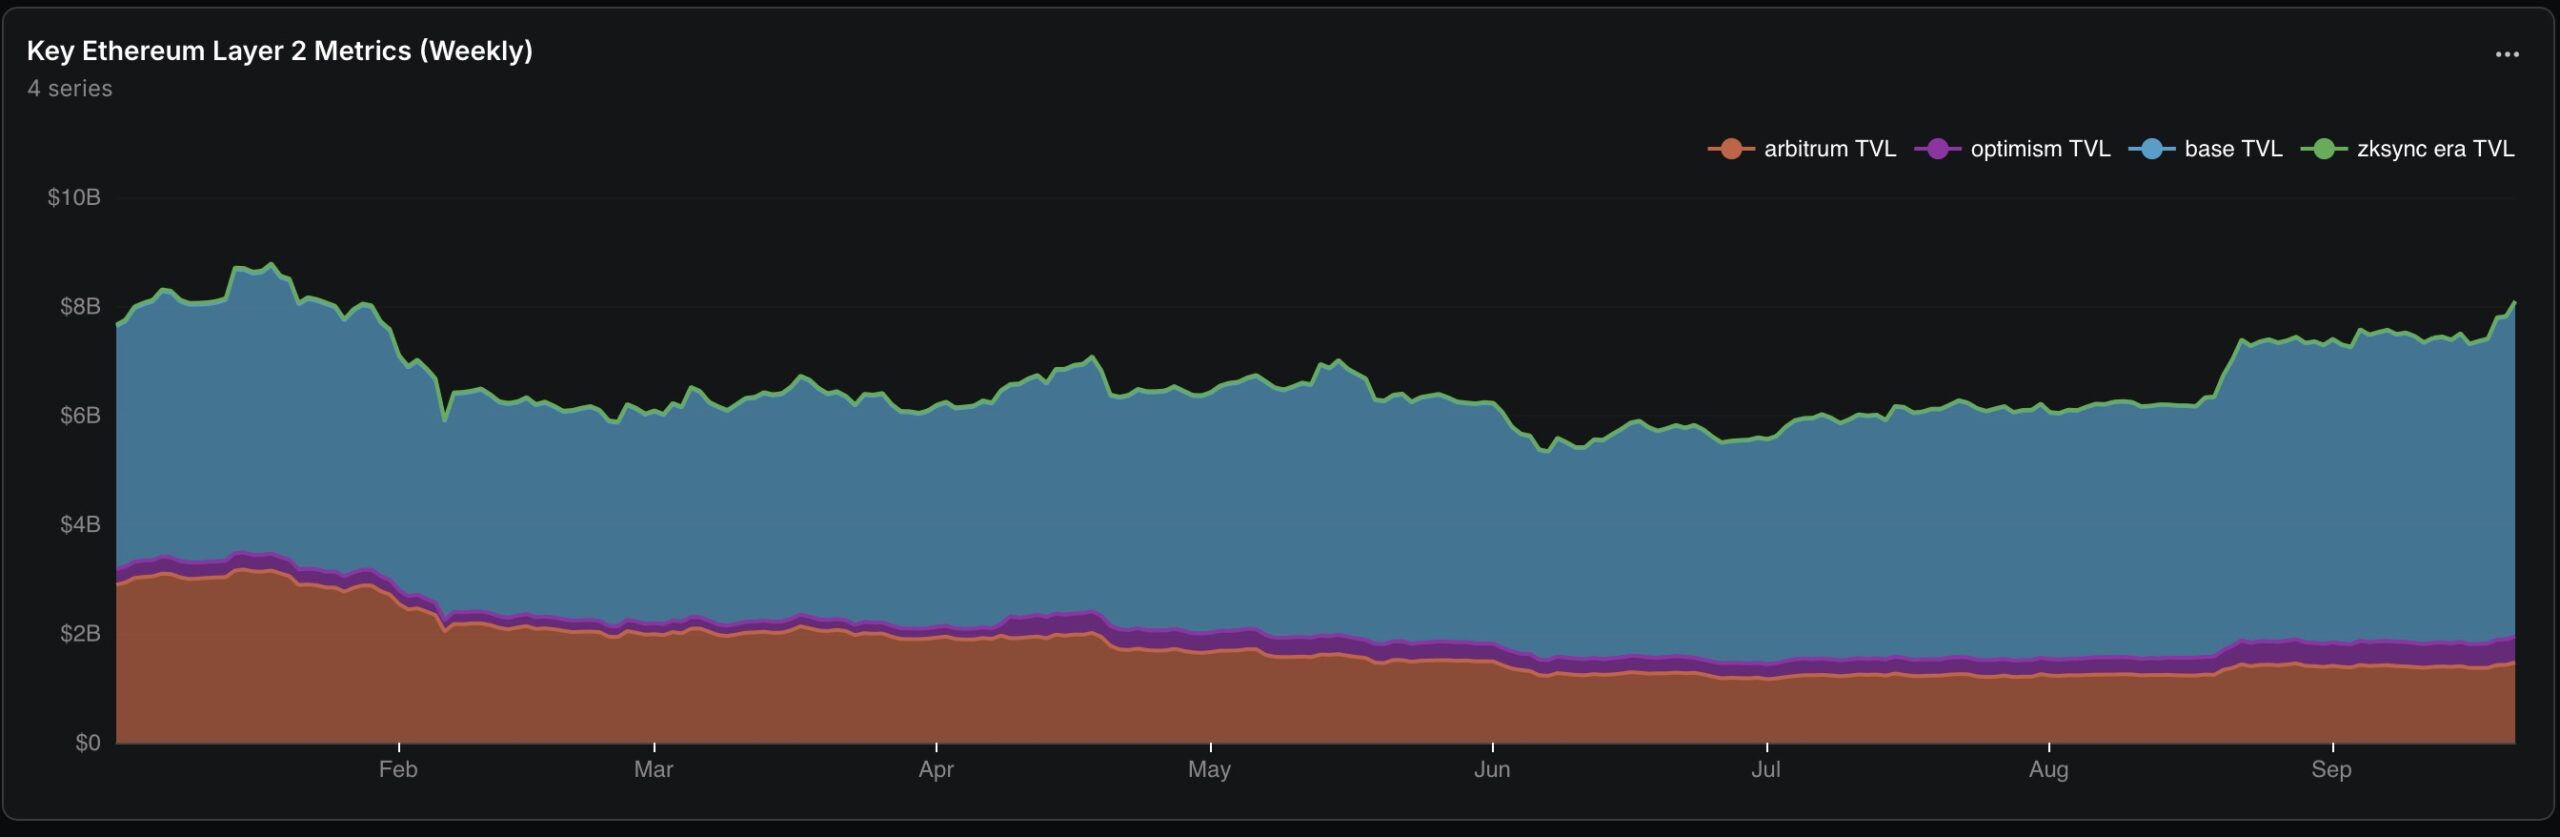
Beneath the price action, network fundamentals are strengthening. Transaction volumes and total value locked across Layer 2 networks such as Base, Arbitrum and Optimism have rebounded, suggesting real demand rather than a rally driven purely by short covering. Growth in DeFi activity, stablecoin issuance and real-world-asset tokenization adds further support, and higher usage feeds Ethereum’s fee-burning mechanism, which offsets new issuance.
Meanwhile, Bitcoin has spent much of the past month stuck in a consolidation range, prompting capital to rotate toward large-cap altcoins with more room to catch up. The ETH/BTC pair has bounced after a long stretch of underperformance, and spot Ethereum ETFs have drawn inflows that kept pace with, and at times outpaced, Bitcoin products during September. Readers tracking which altcoins are catching a similar bid can review this roundup of altcoins riding the ETF inflow wave.
Bull Case Versus Bear Risk at the $2,800 Ceiling
BREAKING: Bitcoin reclaims $82,000 and Ethereum surges above $2,700.
Both BTC and ETH have hit their highest levels in almost 8 months.
$800 BILLION has been added to the crypto market since the June lows. pic.twitter.com/hQSQFdKpj8
— Bull Theory (@BullTheoryio) September 21, 2026
The bullish scenario is straightforward: if ETH holds above $2,700 and absorbs selling at $2,800 without surrendering its recent gains, the route toward $3,000 opens up. A weekly close above $2,800 would be the clearest confirmation.
The risk case is equally clear. A rejection at $2,800 could send ETH back into its former range, with $2,395, the floor that held throughout late August and September, as the first major support. A break below that would put the $2,140 zone and the rising 200-day average near $2,080 back in play.
Until then, any pullback toward $2,600–$2,700 is better read as the breakout needing more time than as a confirmed reversal.
Market Intelligence: Crypto Security Analyst Recommends Best Anonymous Crypto Wallets