




 Some of the links on this site may be affiliate links. ICOBench may receive advertising commissions when users visit recommended platforms via our affiliate links, at no additional cost to you. All recommendations are based on a comprehensive review process.
Ethereum is showcasing impressive metrics, including rollups processing about 1,270 user operations per second and over $17Bn in tokenized assets settled on-chain.
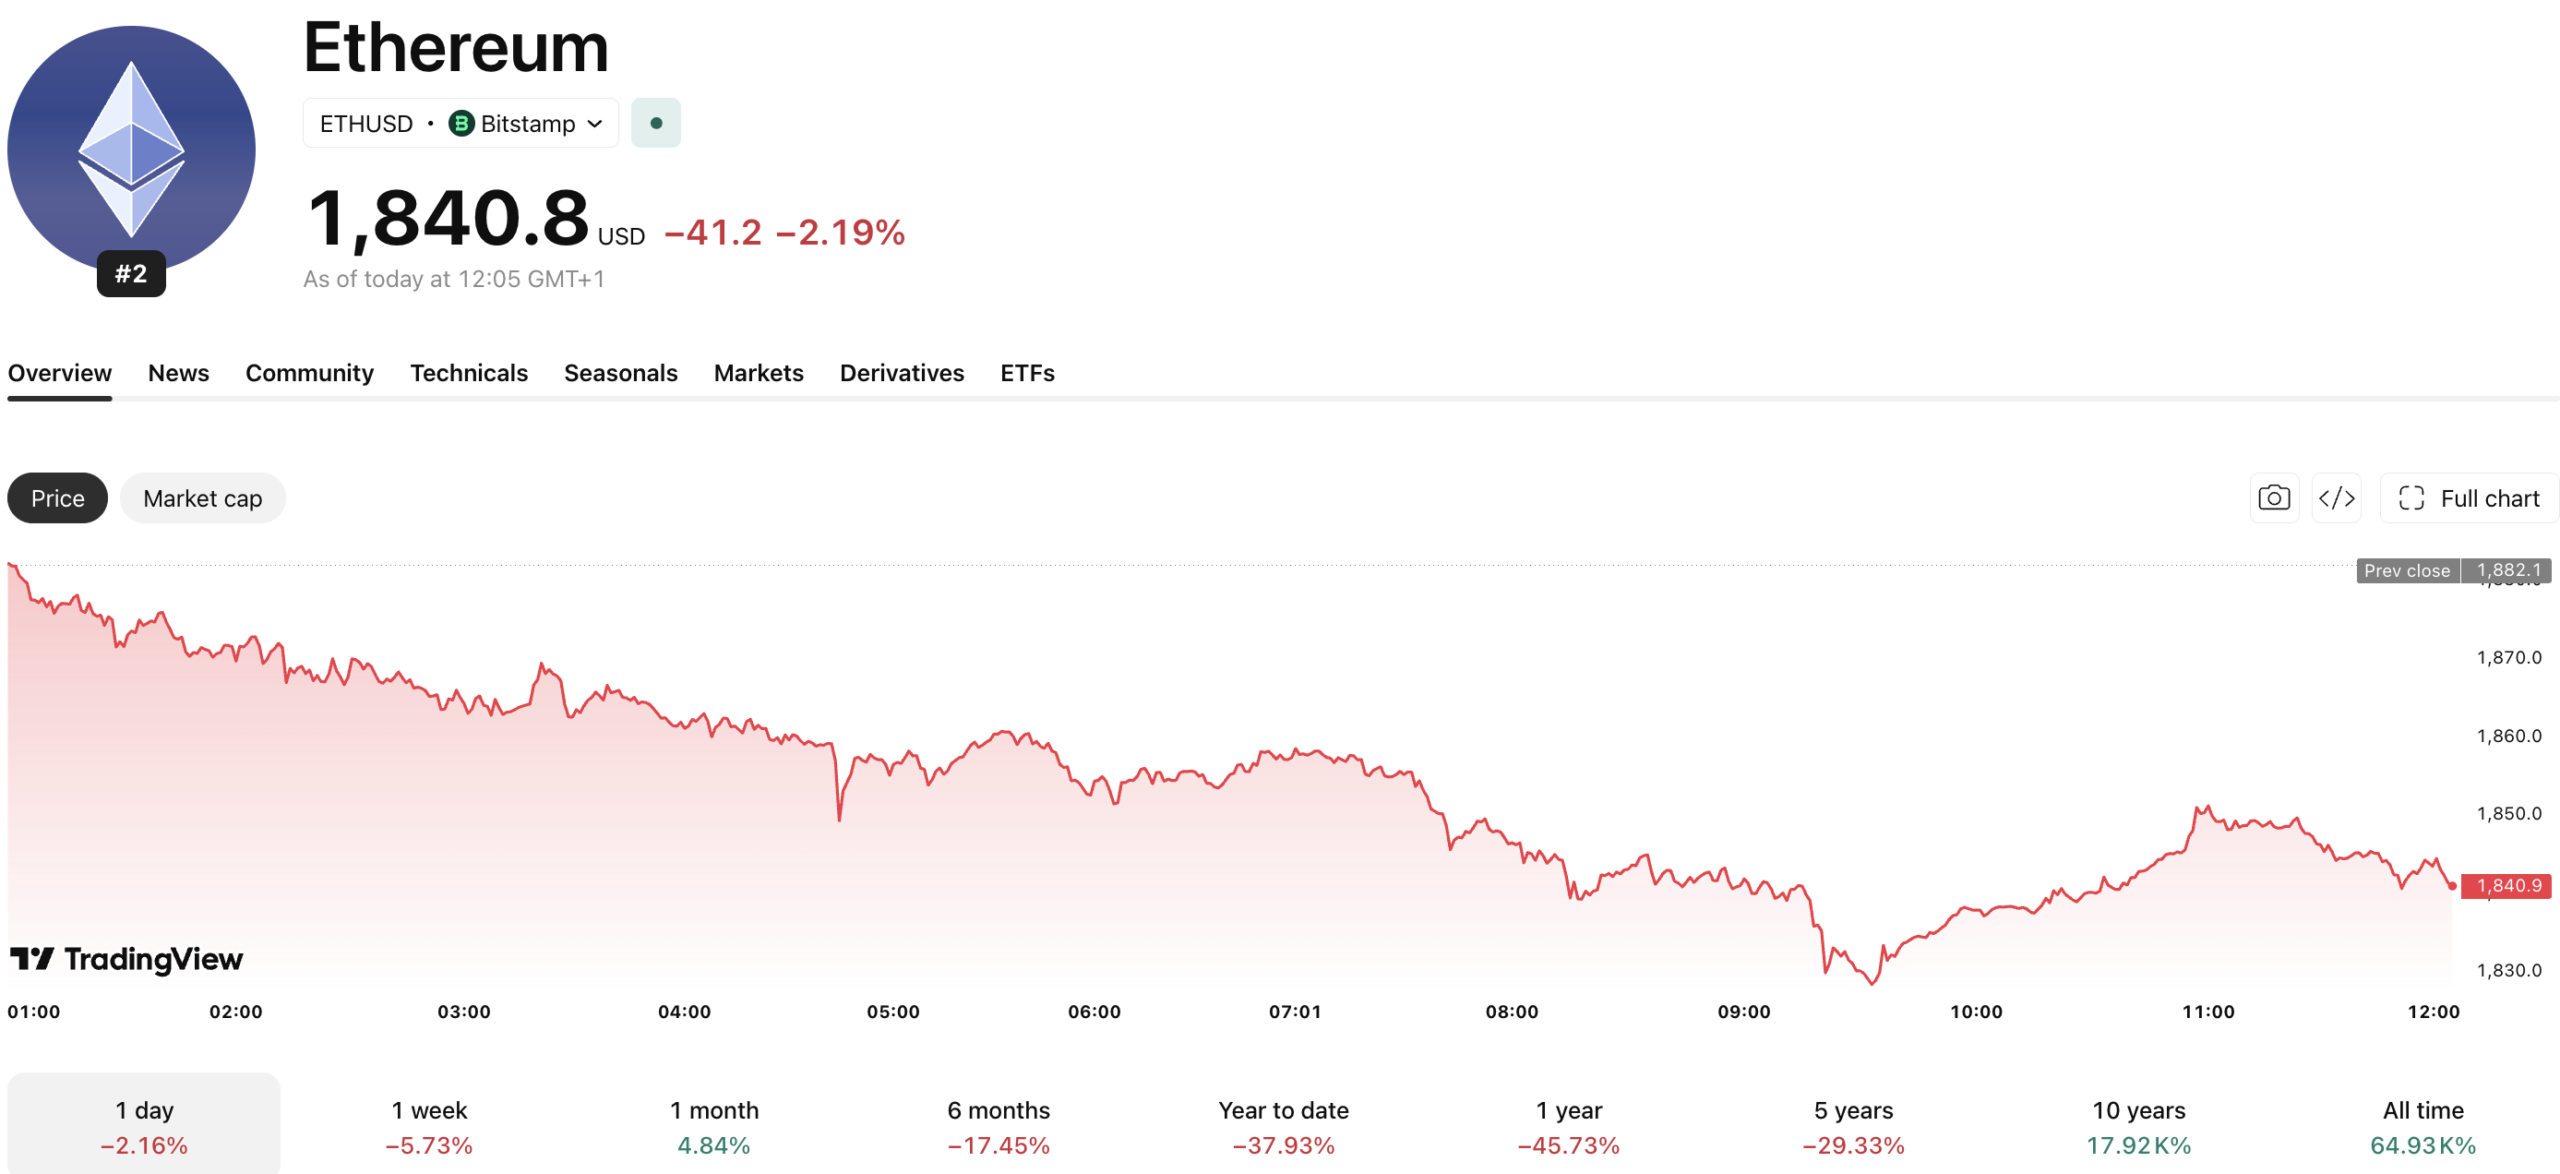
Despite these achievements, the ETH price remains under $2,000, around 60% down from its all-time high, with a 10.4% ETH dominance, the lowest since mid-2021.
➥ Ethereum is scaling faster than ever, yet $ETH is still trading below $2,000
As someone who actually holds ETH, I think this disconnect is the most important debate in the ecosystem right now.
Q2 numbers were not terrible, but they exposed a structural weakness:
– Ethereum… https://t.co/c8UCEkhCk9 pic.twitter.com/ke8X3XcEiI
— Tanaka (@Tanaka_L2) July 31, 2026
Analysts note a decline in the ETH/BTC ratio to about 0.027, nearing five-year lows, raising questions about whether this is a temporary cycle low or whether Ethereum’s scaling has permanently decoupled network usage from ETH’s value capture.
Analyst Tanaka highlighted a key issue: Ethereum L1 generated roughly $1.79Bn in fees in Q2 2026, but ETH captured only about 4.9% of that value. While Real Economic Value rose 7% quarter-over-quarter, it fell 68% year-over-year, suggesting that the old fee-burn thesis may now be obsolete.
Ethereum Value Capture: What the 4.9% Fee Retention Rate Actually Reveals About the L2 Decoupling Problem
The 4.9% value capture figure stems from a strategic architectural decision following EIP-4844, which allowed Layer 2 (L2) networks to post compressed data to Ethereum L1 at significantly reduced costs.
This shift resulted in a dramatic drop in daily L1 fees, from over $30M to around $500,000, and a decrease in ETH burns to about 100 ETH, leading to a slight inflationary shift in Ethereum’s annual supply growth.
L2 rollups now handle approximately 1,270 user operations per second, compared to just 20.4 on Ethereum mainnet, showcasing a scaling factor of 41.6x. For instance, Robinhood Chain processes about 96.2 UOPS, while Coinbase’s Base L2 brought in over $94M in profit but contributed only $4.9M back in blob fees.
Tanaka’s analysis describes this period as margin compression, not structural failure; Ethereum is accepting lower short-term revenue to broaden its ecosystem. The recent seven-day blob fee burn reflected only about 0.22 ETH, underscoring diminished returns for ETH holders.
The Glamsterdam upgrade aimed to address these issues with parallel transaction processing and a projected 78% reduction in gas fees, but delays due to scope creep and technical challenges have postponed its delivery to late 2026, extending the current underperformance period.
Institutional Settlement Layer: What $15Bn in Tokenized RWAs and a $300B Stablecoin Market Actually Reveal About Ethereum’s Real Bull Case
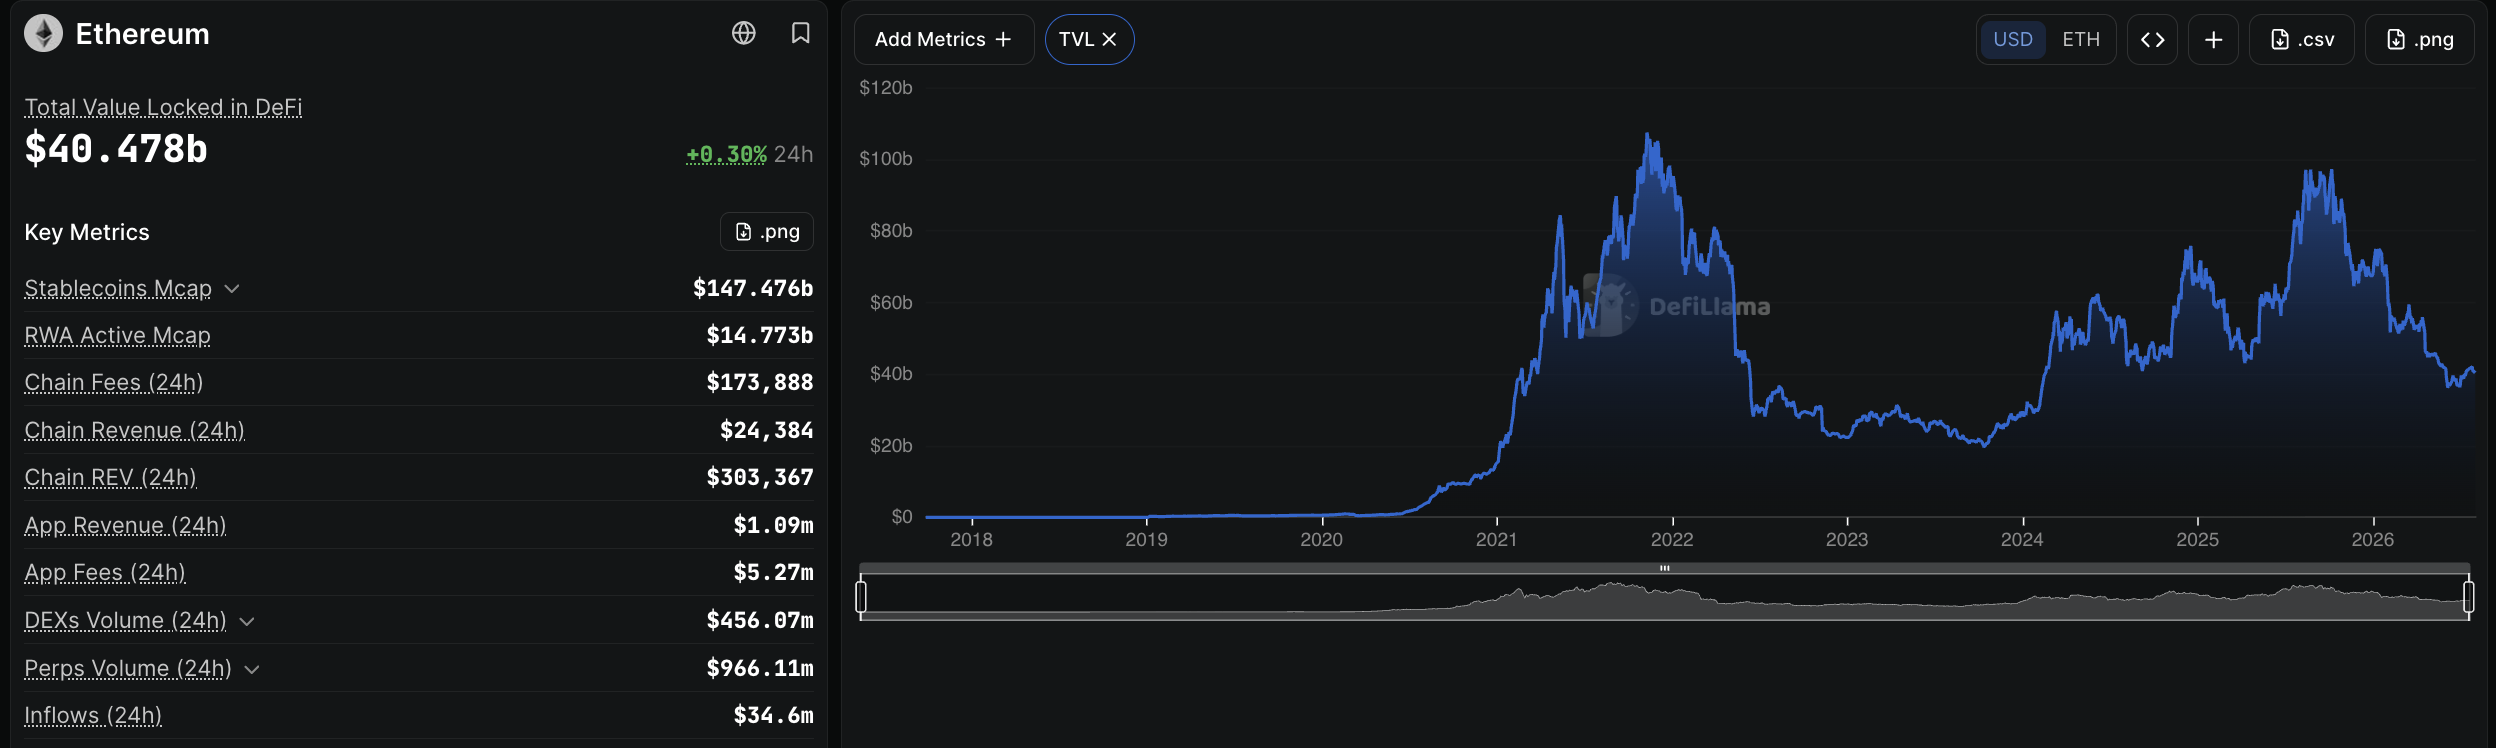
Tanaka’s revised bull case for Ethereum argues that its competitive advantage has shifted from low transaction fees to institutional liquidity, settlement credibility, and a concentration of tokenized financial assets.
As of late July 2026, Ethereum holds about $15Bn in tokenized RWAs, while the stablecoin market, valued at roughly $299.4Bn, is predominantly settled on Ethereum L1.
On-chain analysis shows Ethereum’s dominance in total value locked (TVL), stablecoin issuance, and institutional infrastructure, remaining strong despite Solana’s growth in DeFi.
The Pectra upgrade in 2026 enhanced validator user experience and network security without addressing fee capture. BlackRock’s filing for a staked Ethereum ETF could portray ETH as a yield-bearing asset rather than just a speculative token.
Tanaka identified three conditions to validate the settlement layer thesis: L2 demand making blob space valuable, active on-chain turnover for stablecoins and RWAs, and institutions using ETH as reserve collateral.
While none are guaranteed, the traction seen in stablecoins and RWAs supports Tanaka’s view that holding and accumulating ETH is worthwhile at current prices.
ETH Price Analysis: What the 0.027 ETH/BTC Ratio and Sub-$2,000 Structure Actually Reveal About Near-Term Recovery Risk
$ETHBTC is showing signs of being BROKEN OUT, in similar fashion to 2017's breakout just before that MONSTROUS RUN & ALT SEASON!
Another humongous move could be in its early stages, right here and right now…
(Ethereum vs. Bitcoin) pic.twitter.com/kCGDu1LcZl
— JAVON⚡️MARKS (@JavonTM1) August 2, 2026
ETH fell about 27% in Q1 2026, while Bitcoin declined by 20%, marking one of the widest quarterly ETH/BTC divergences recently, per TradingView data. The ETH/BTC ratio, at 0.027-0.030, is near five-year lows and below the 200-week moving average.
As of June 30, ETH was in a bearish channel on the two-hour chart, with key demand around $1,509. A 17-day outflow from spot ETH ETFs removed approximately $708M from products like ETHA and FETH, indicating institutional de-risking.
The current ETH/BTC level at 0.028-0.030 is crucial, as previous alt seasons began with a sustained ETH/BTC rally, which hasn’t been seen in 2026.
If Glamsterdam achieves its goals and the staked ETH ETF passes regulatory reviews, it could shift institutional perception of ETH to a yield-bearing asset.
Until then, the ETH price remains discounted relative to network activity, with holders focusing on the gap between Ethereum’s infrastructure and ETH’s value capture.