

Bitcoin’s price fell by 3% to $59,300 on Friday, June 27, 2026, extending a weekly loss of nearly -5% as the crypto market sell-off deepened across all major digital asset classes, with Bitcoin ETF outflows suffering.
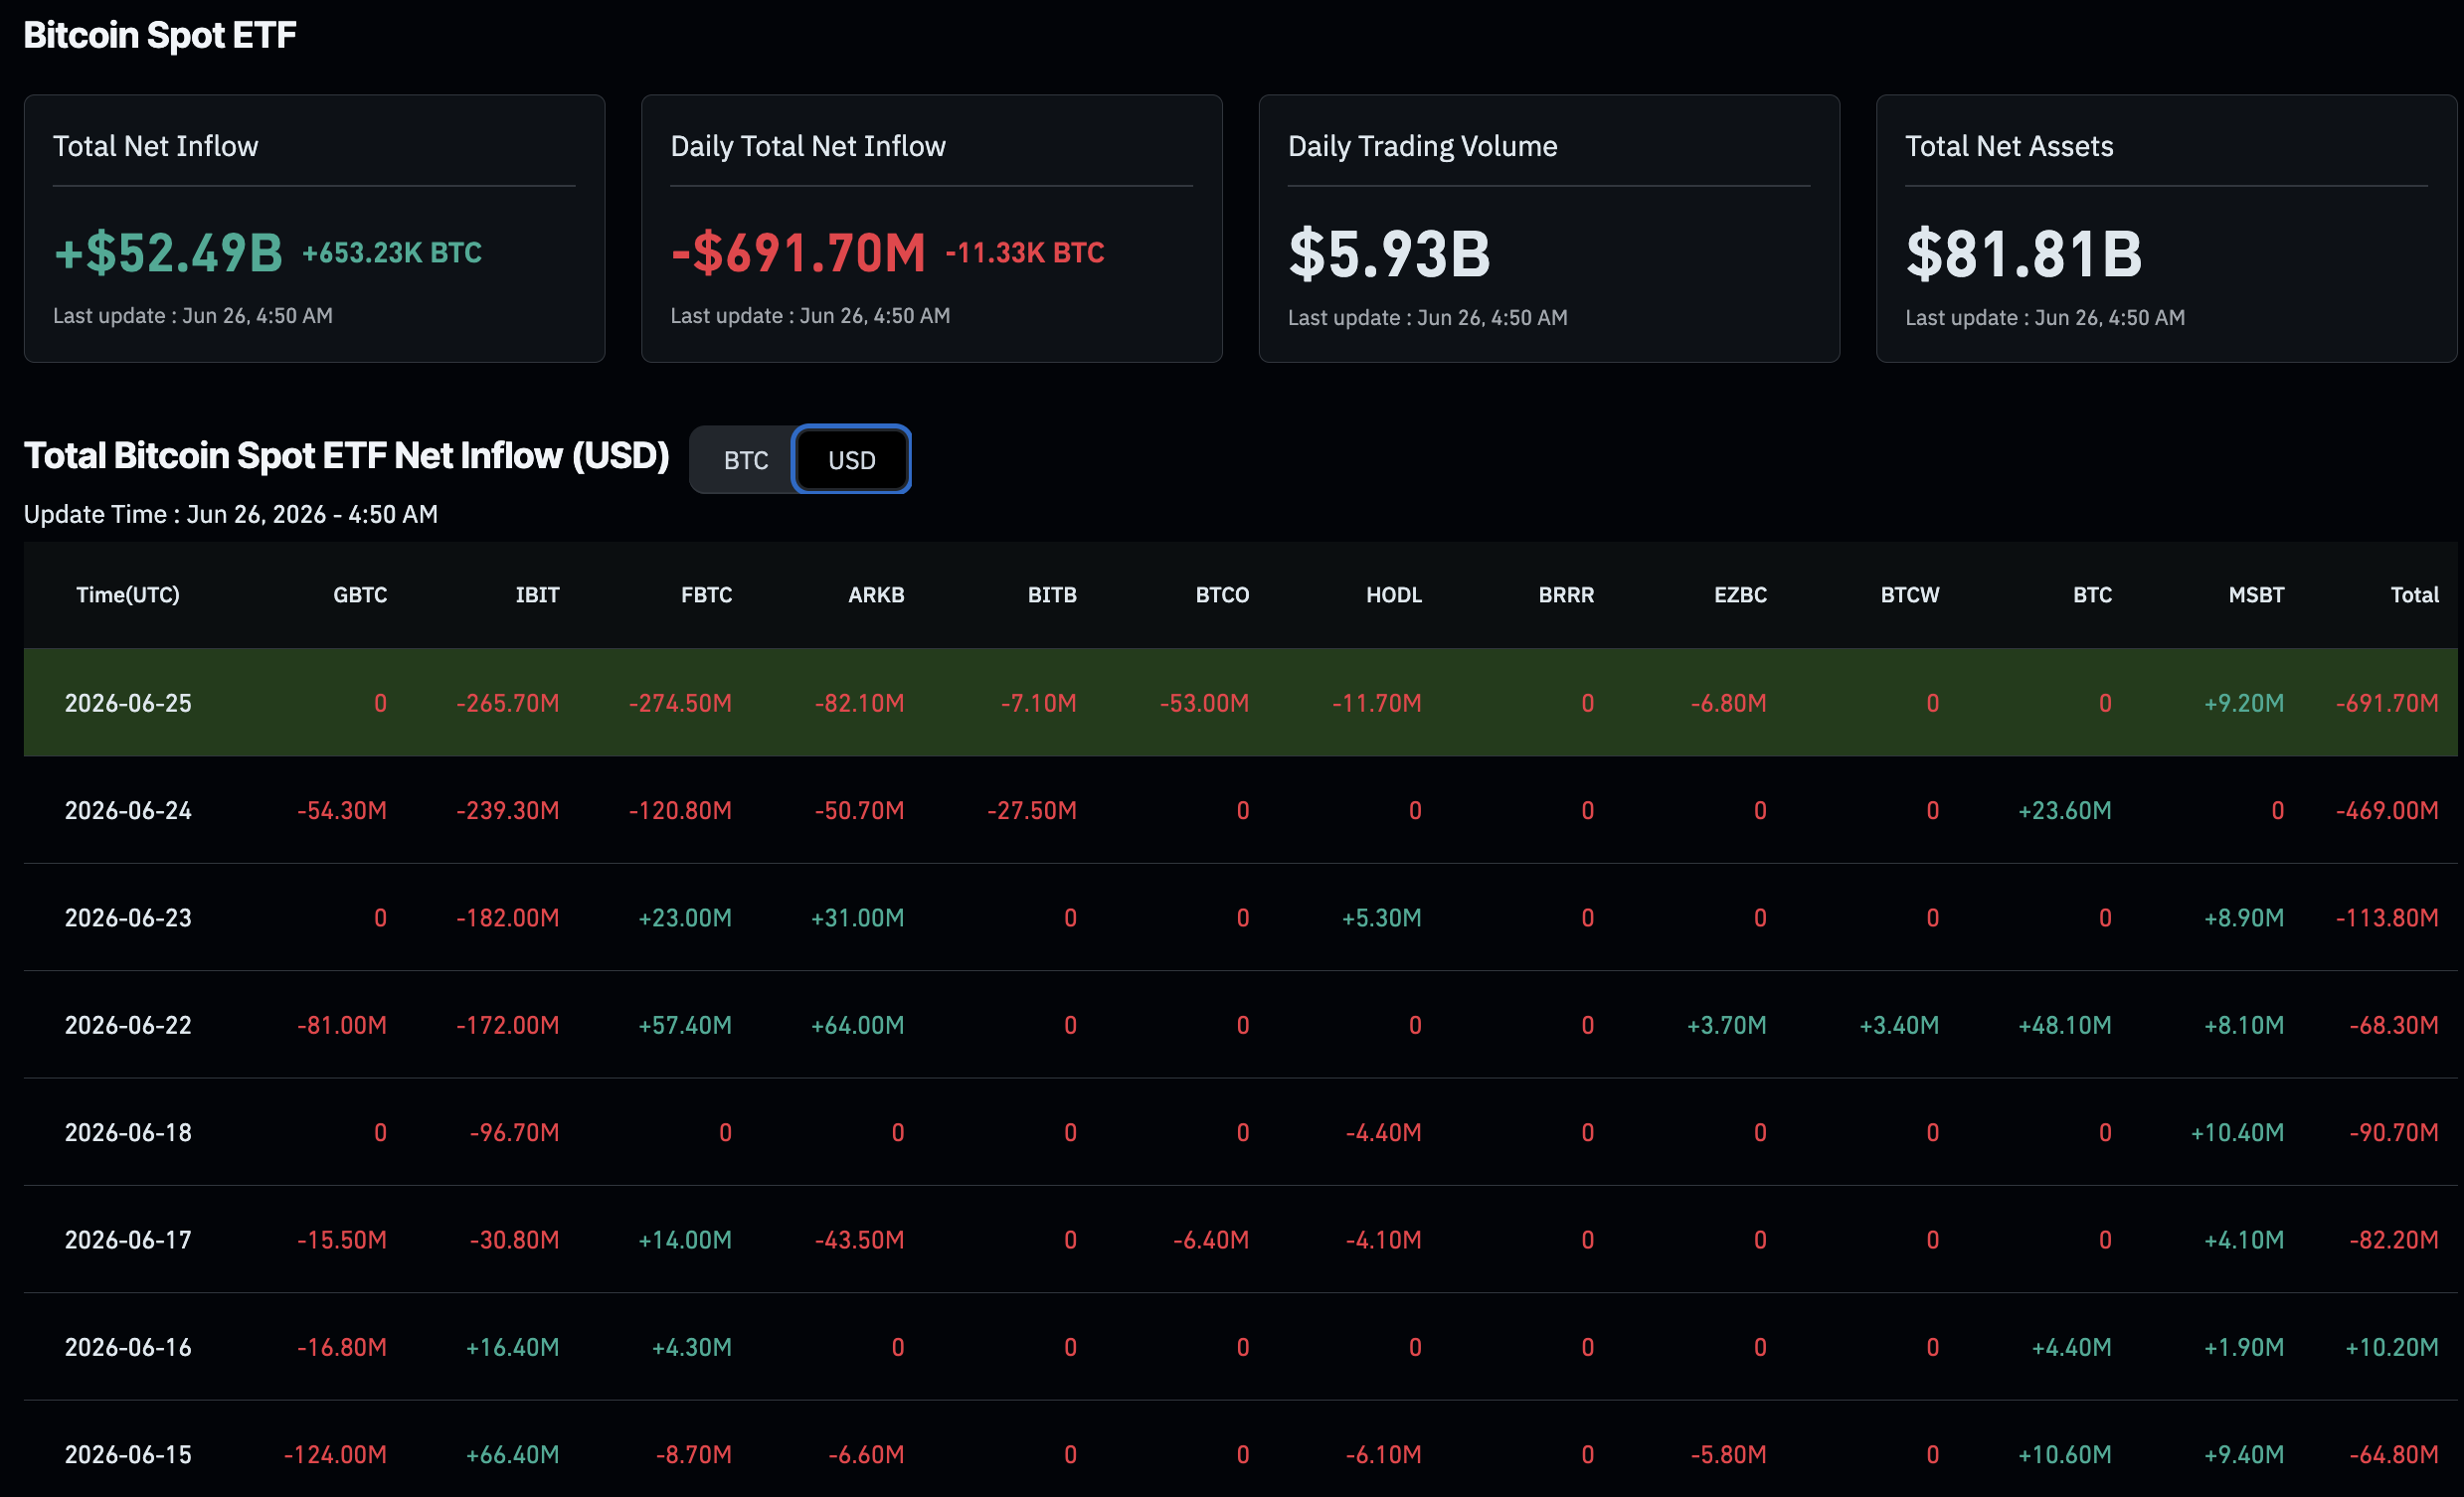
The immediate structural catalyst is unambiguous: spot Bitcoin ETF products recorded their seventh consecutive week of net outflows, pulling $1.35Bn from funds tracked by SoSoValue in the most recent weekly window alone, with a single-day redemption of $469M on June 25 marking the largest daily withdrawal since June 2.
Compounding the ETF bleed, sticky PCE inflation data released Thursday reinforced the Federal Reserve’s hawkish posture. Ethereum slid -5.2% to $1,545 near a 14-month low.
The open question the market must now resolve is whether BTC support at $60K holds as a structural floor or becomes the next line of capitulation in a deteriorating macro and flow environment.
Spot Bitcoin ETF Outflows: What $1.35Bn in a Single Week and Seven Consecutive Redemption Cycles Actually Reveal
BREAKING: US Bitcoin ETFs saw -$6.4 billion in outflows over the last 30 days, the largest 30-day outflow on record.
Last week alone, Bitcoin ETFs posted -$233 million in withdrawals.
Overall, crypto funds saw -$116 million in outflows last week, marking the 5th consecutive… pic.twitter.com/EJOJJGwNqf
— The Kobeissi Letter (@KobeissiLetter) June 24, 2026
The $1.35 billion outflow figure requires contextual understanding. Cumulative net withdrawals over the past month have reached around $6Bn, marking the largest monthly redemption since the January 2024 launch of spot Bitcoin ETFs, which initially saw over $15Bn in inflows before interest faded.
Recent data indicate that outflows intensified after a brief pause, with a notable $469M in outflows on a single day on June 25, suggesting that renewed redemption pressure was driven more by macroeconomic factors than by specific fund changes.
Glassnode data reveals a persistent discount on Coinbase, indicating weak US retail demand independent of the ETF redemption cycle.
While it does not imply imminent retail capitulation, it shows that the recovery in spot demand needed to offset ETF selling is lacking.
Additionally, Fed funds futures suggest at least one more rate hike by the end of 2026, driven by strong labor data and persistent inflation, reinforcing the impact of the high-rate environment on speculative assets.
While the outflow data doesn’t confirm a rate hike, it does indicate that institutional ETF investors are positioning as if one may occur.
What Sticky PCE Inflation and AI Capital Rotation Actually Mean for Bitcoin: The Transmission Path
The Federal Reserve adopted a hawkish stance last week, as highlighted by Thursday’s PCE price index data, which showed inflation remains well above the 2% target.
This supports a bearish outlook for Bitcoin, as sticky inflation reduces the likelihood of rate cuts, raises real yields, and increases the opportunity cost of holding non-yielding assets like BTC.
This dynamic may prompt institutional ETF holders to shift into yield-bearing alternatives, further pressuring Bitcoin’s spot price in the absence of retail support.
Simultaneously, capital is flowing into AI and semiconductor stocks, such as Micron and SanDisk, as evidenced by their significant gains even as Bitcoin fell -3%.
The broader equity market also struggled, with the Nasdaq down -0.46%, Apple dropping -6.12%, and MicroStrategy falling -9.35%.
This risk-off sentiment in equities removes the positive support that Bitcoin has occasionally counted on, leaving it facing macro headwinds without any positive inflow catalysts.
DISCOVER: Best Crypto Presales to Watch Right Now
BTC Price Analysis: What the $60K Support Level and Altcoin Spread Actually Reveal About Directional Risk
$BTC hit a new low yesterday.
And is now back above $60,000.
The majority of this small move in Bitcoin is due to short positions being closed, which is exactly what we saw tomorrow. pic.twitter.com/luCidfbuCp
— Ted (@TedPillows) June 26, 2026
Bitcoin’s continued trading below $60,000 is significant, with technical analysis indicating support at $60,587. The $60,000–$62,500 range represents a key demand zone that has previously absorbed selloffs.
A daily close below $59,500 could trigger a drop towards the $50,000 area, where analysts see meaningful support due to a lack of on-chain accumulation signals.
The three-scenario framework for BTC over the next two to four weeks:
- Bull case: ETF outflows stabilize or reverse on a weekly basis, PCE trajectory cools in the next print, and BTC reclaims $62,500 with volume – opening a path back toward the $65,000–$68,000 range that capped the prior attempted recovery.
- Base case: BTC oscillates between $58,500 and $62,000 as the macro backdrop remains uncertain, ETF outflows continue at a reduced pace, and the Coinbase discount persists – range-bound compression with bearish lean.
- Bear/invalidation: A confirmed daily close below $59,000, particularly if accompanied by another week of ETF outflows exceeding $1Bn, triggers cascade selling toward $52,000–$54,000, where prior cycle consolidation zones provide the next structural support.