Bitcoin (BTC) has gone down by 2.6% in the past 24 hours and currently sits above $115,000 as the market’s latest pullback continues to unfold.
President Donald Trump signed on Thursday the implementation of ‘reciprocal’ tariffs on all countries and honored the outcome of the negotiations that were held during a 90-day period.
Countries like China, Mexico, and Canada – traditional commercial allies to the U.S. – were slapped with the highest tariffs as negotiations did not yield much fruit.
Meanwhile, the Federal Reserve opted not to make any changes to its benchmark interest rate this week as the market expected. This provided additional clarity to participants and should contribute to reducing volatility.
Bitcoin’s trading volumes have surged by nearly 29% in the past 24 hours as the token reacted strongly upon hitting the $114K mark. It appears that buying interest at this level is quite strong.
There's no way people are getting bearish on $BTC.
It had a perfect breakout from the inverse head and shoulder pattern.
And now, it's retesting the breakout level.
Also, there's a CME gap around $114.2K level, which will most likely get filled.
After that, I'm expecting a… pic.twitter.com/7RKNul3qgd
— BitBull (@AkaBull_) August 1, 2025
The well-known crypto trader BitBull, whose account on X is followed by more than 60,000 users, shared a bullish chart that anticipates an explosive move for Bitcoin.
In the daily time frame, an inverse head and shoulders pattern has formed. This setup has already been confirmed by a bullish breakout of the neckline and the price has now retested this area.
If Bitcoin bounces off the neckline after this retest, this would provide a second confirmation of its bullish bias, especially if a big green candle pops up in the lower time frames.
Here’s What Needs to Happen for Bitcoin to Hit $120K Again
Heading to the 4-hour chart, we can see multiple candles leaving behind a big long wick on the lower part, which typically means that buying pressure is high at those low levels.
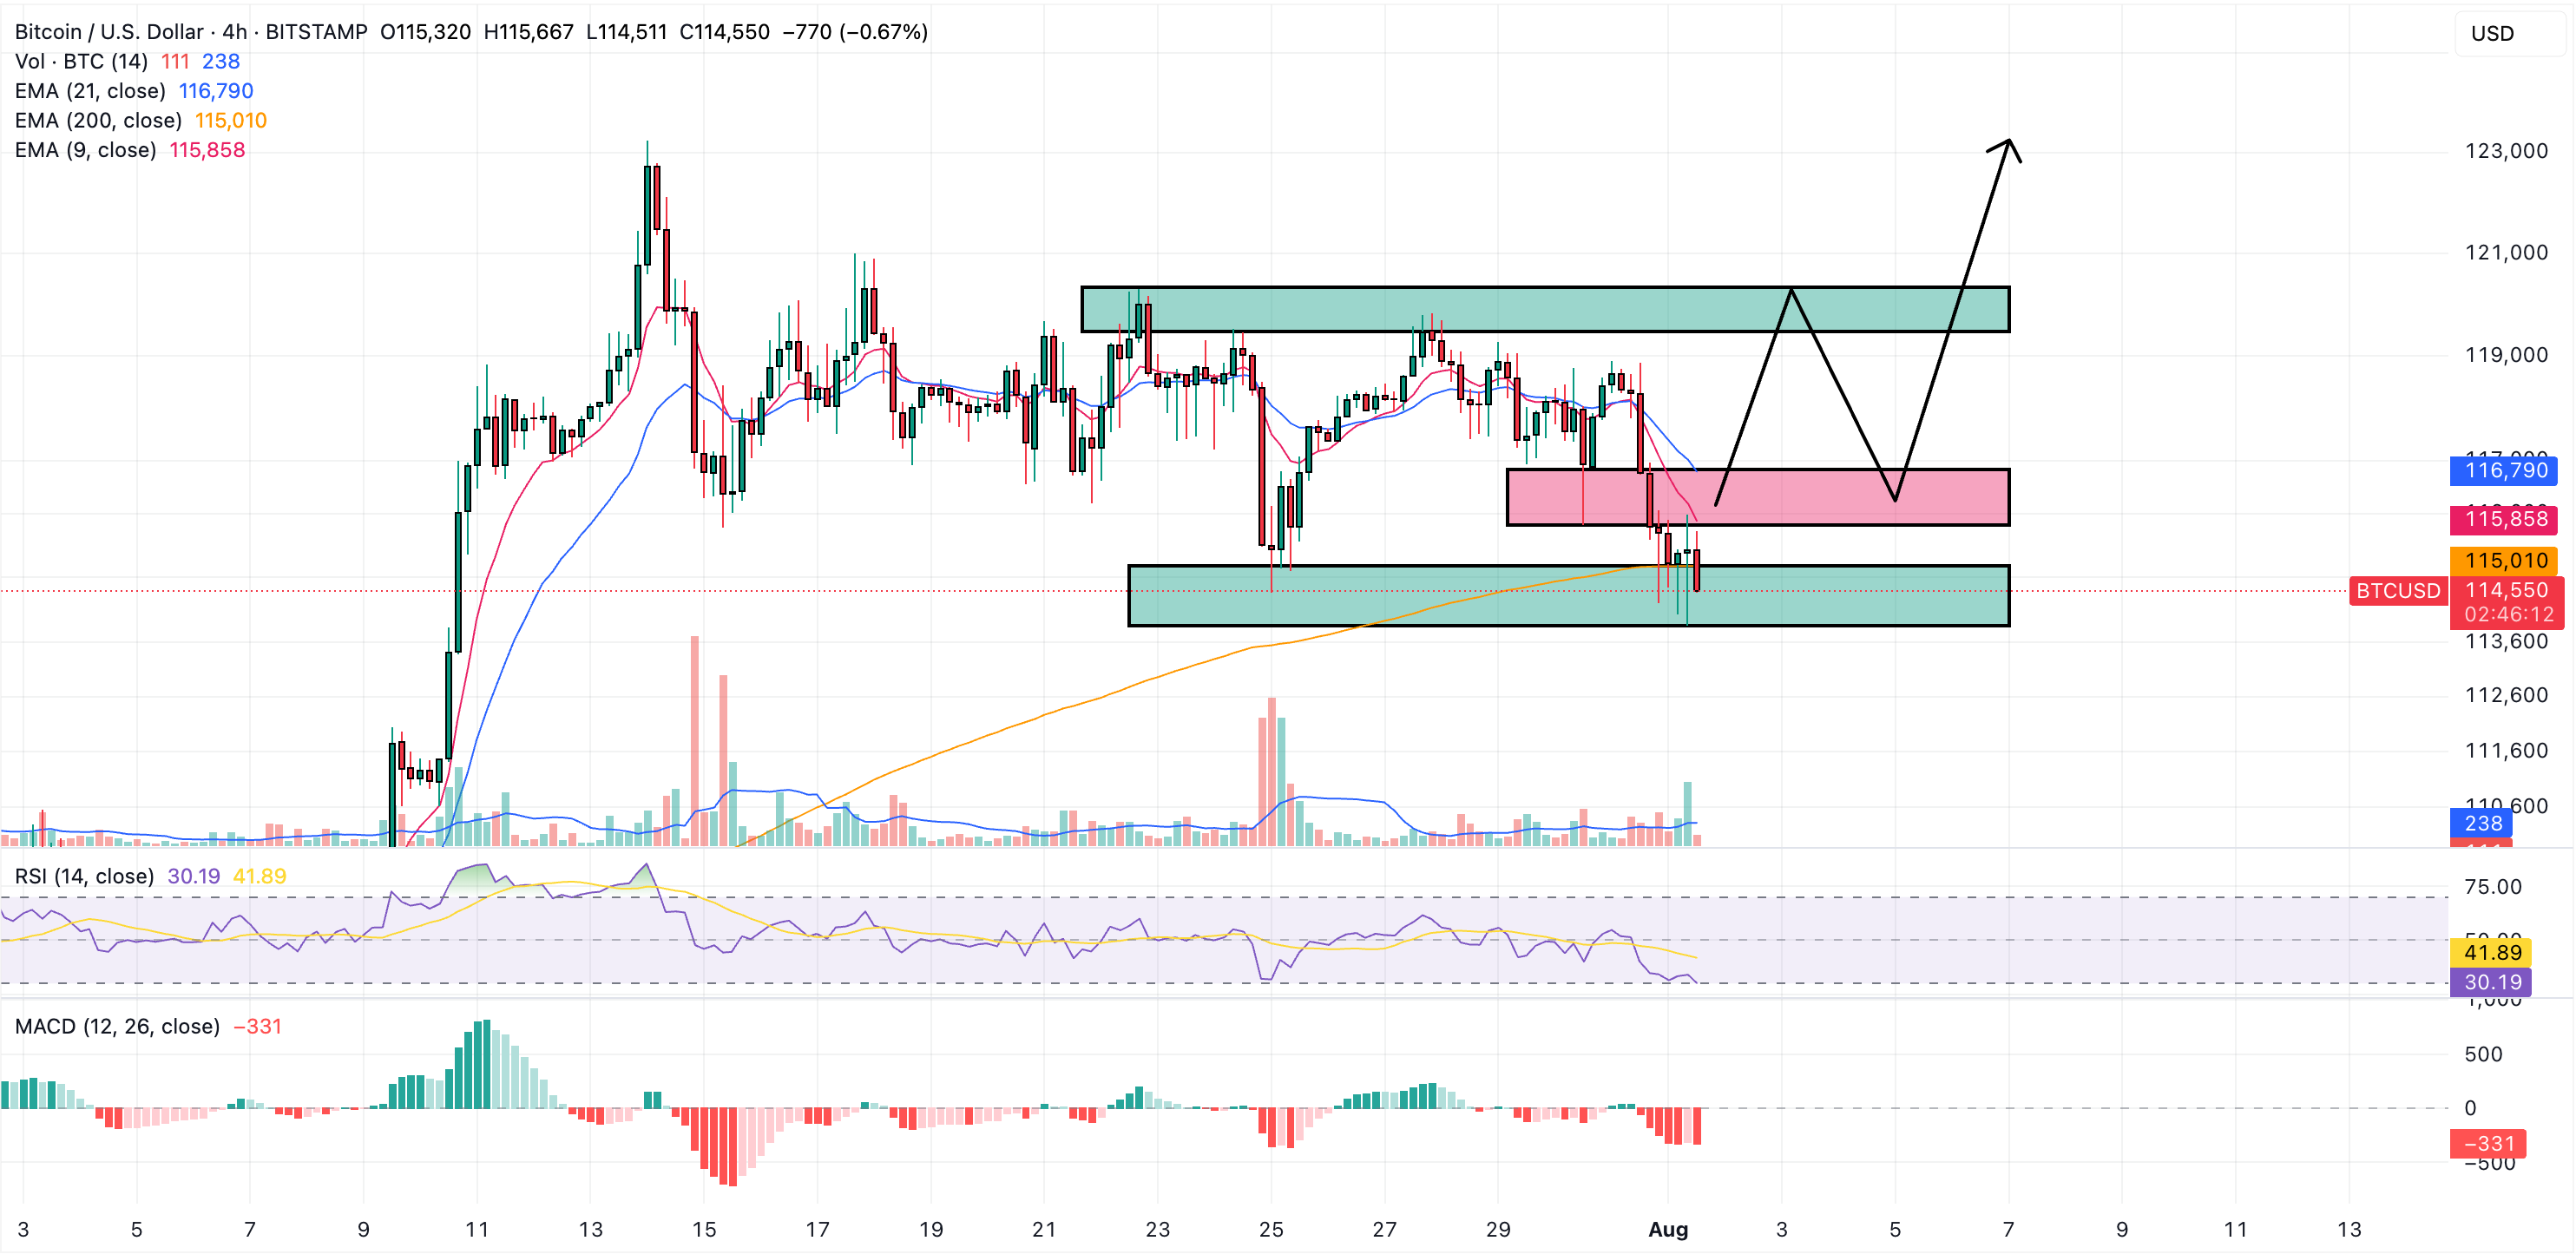
The price has been closing above the $114,000 area in the last 24 hours, which is a positive sign that could precede a big bullish move.
This support level coincides with the 200-period exponential moving average (EMA) in this lower time frame. This increases its relevance from a technical standpoint.
The American session’s opening could not break below the $114K mark either, despite some big volumes going on during that time frame.
A strong move off this low level could follow a path similar to the one shown in the chart, where the $116K area is broken and retested in anticipation of a much stronger move toward the $120K resistance.
That said, momentum indicators have not yet confirmed a bullish outlook. Ideally, the Relative Strength Index (RSI) should rise above the 14-day moving average in the next few hours.
As Bitcoin’s prospects improve, the best crypto presales like Maxi Doge (MAXI) should benefit the most if the top crypto makes a new all-time high in the next couple of weeks.
Maxi Doge (MAXI) Nears $200K Raised Just a Couple of Days After its Launch
Maxi Doge (MAXI) embraces “up only” culture during what could be one of the most promising bull cycles of this century.
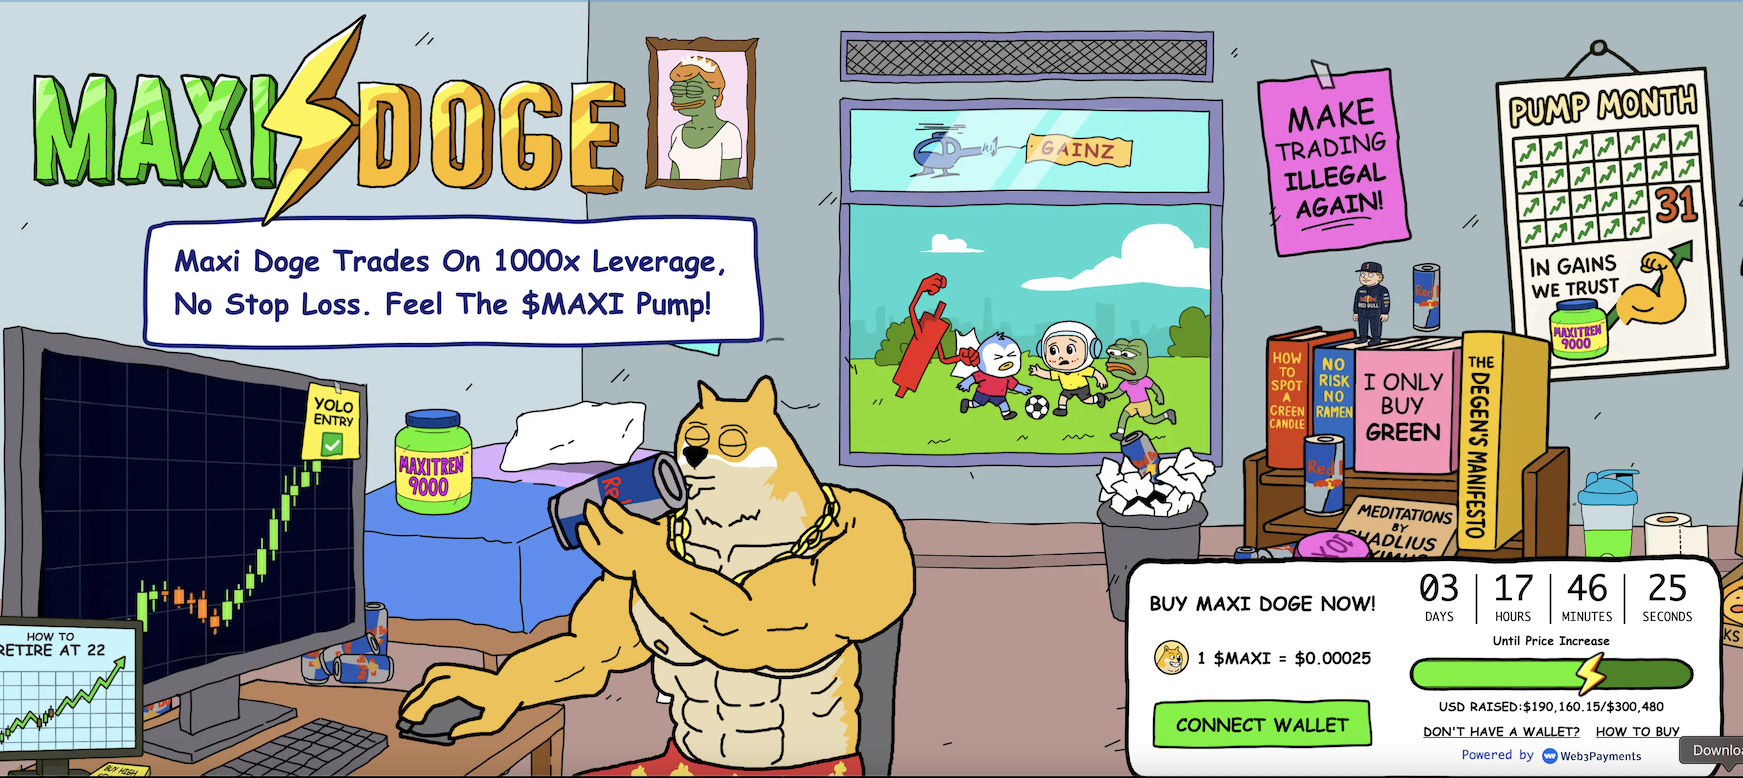
No red candles are permitted this season. Maxi Doge makes the most out of this market by opening positions with 1000x leverage and no stop loss. This token will diamond-hand its way out of mom’s basement and will take the community with it on the way out.
$MAXI is a mix of pure meme culture and FOMO. Taking long positions with that kind of leverage doesn’t usually work out… Until it does! You can either settle for a few hits or take the risk and aim for a home run in a market like this.
Up to 25% of the token’s allocation will go to the Maxi Fund, a pool of capital that will open overleveraged positions in the most promising tokens of this cycle.
To buy $MAXI before it pumps, head to the Maxi Doge website and connect your wallet. You can either swap ETH or USDT for this meme coin or use a bank card to invest.