




 Some of the links on this site may be affiliate links. ICOBench may receive advertising commissions when users visit recommended platforms via our affiliate links, at no additional cost to you. All recommendations are based on a comprehensive review process.
The $75,278 Fibonacci level is the key support to watch in BTC’s current range. If Bitcoin remains above that area, it could retest $76,825; if it breaks below, attention could shift toward $74,000.
Bitcoin traded at $76,358.12 on September 17, up 0.66% over 24 hours. The broader crypto market rose 1.13% over the same period, leaving Bitcoin slightly behind the wider move. This move is attributed in part to an expected 25-basis-point Federal Reserve rate hike on September 16 that arrived without a hawkish surprise, easing selling pressure.
BREAKING: The Federal Reserve officially hikes interest rates by 25 basis points, marking its first rate hike since July 2023.
This ends the longest Fed interest rate pause since 2008.
— The Kobeissi Letter (@KobeissiLetter) September 16, 2026
$75,278 Fibonacci Support Versus $76,825 Resistance
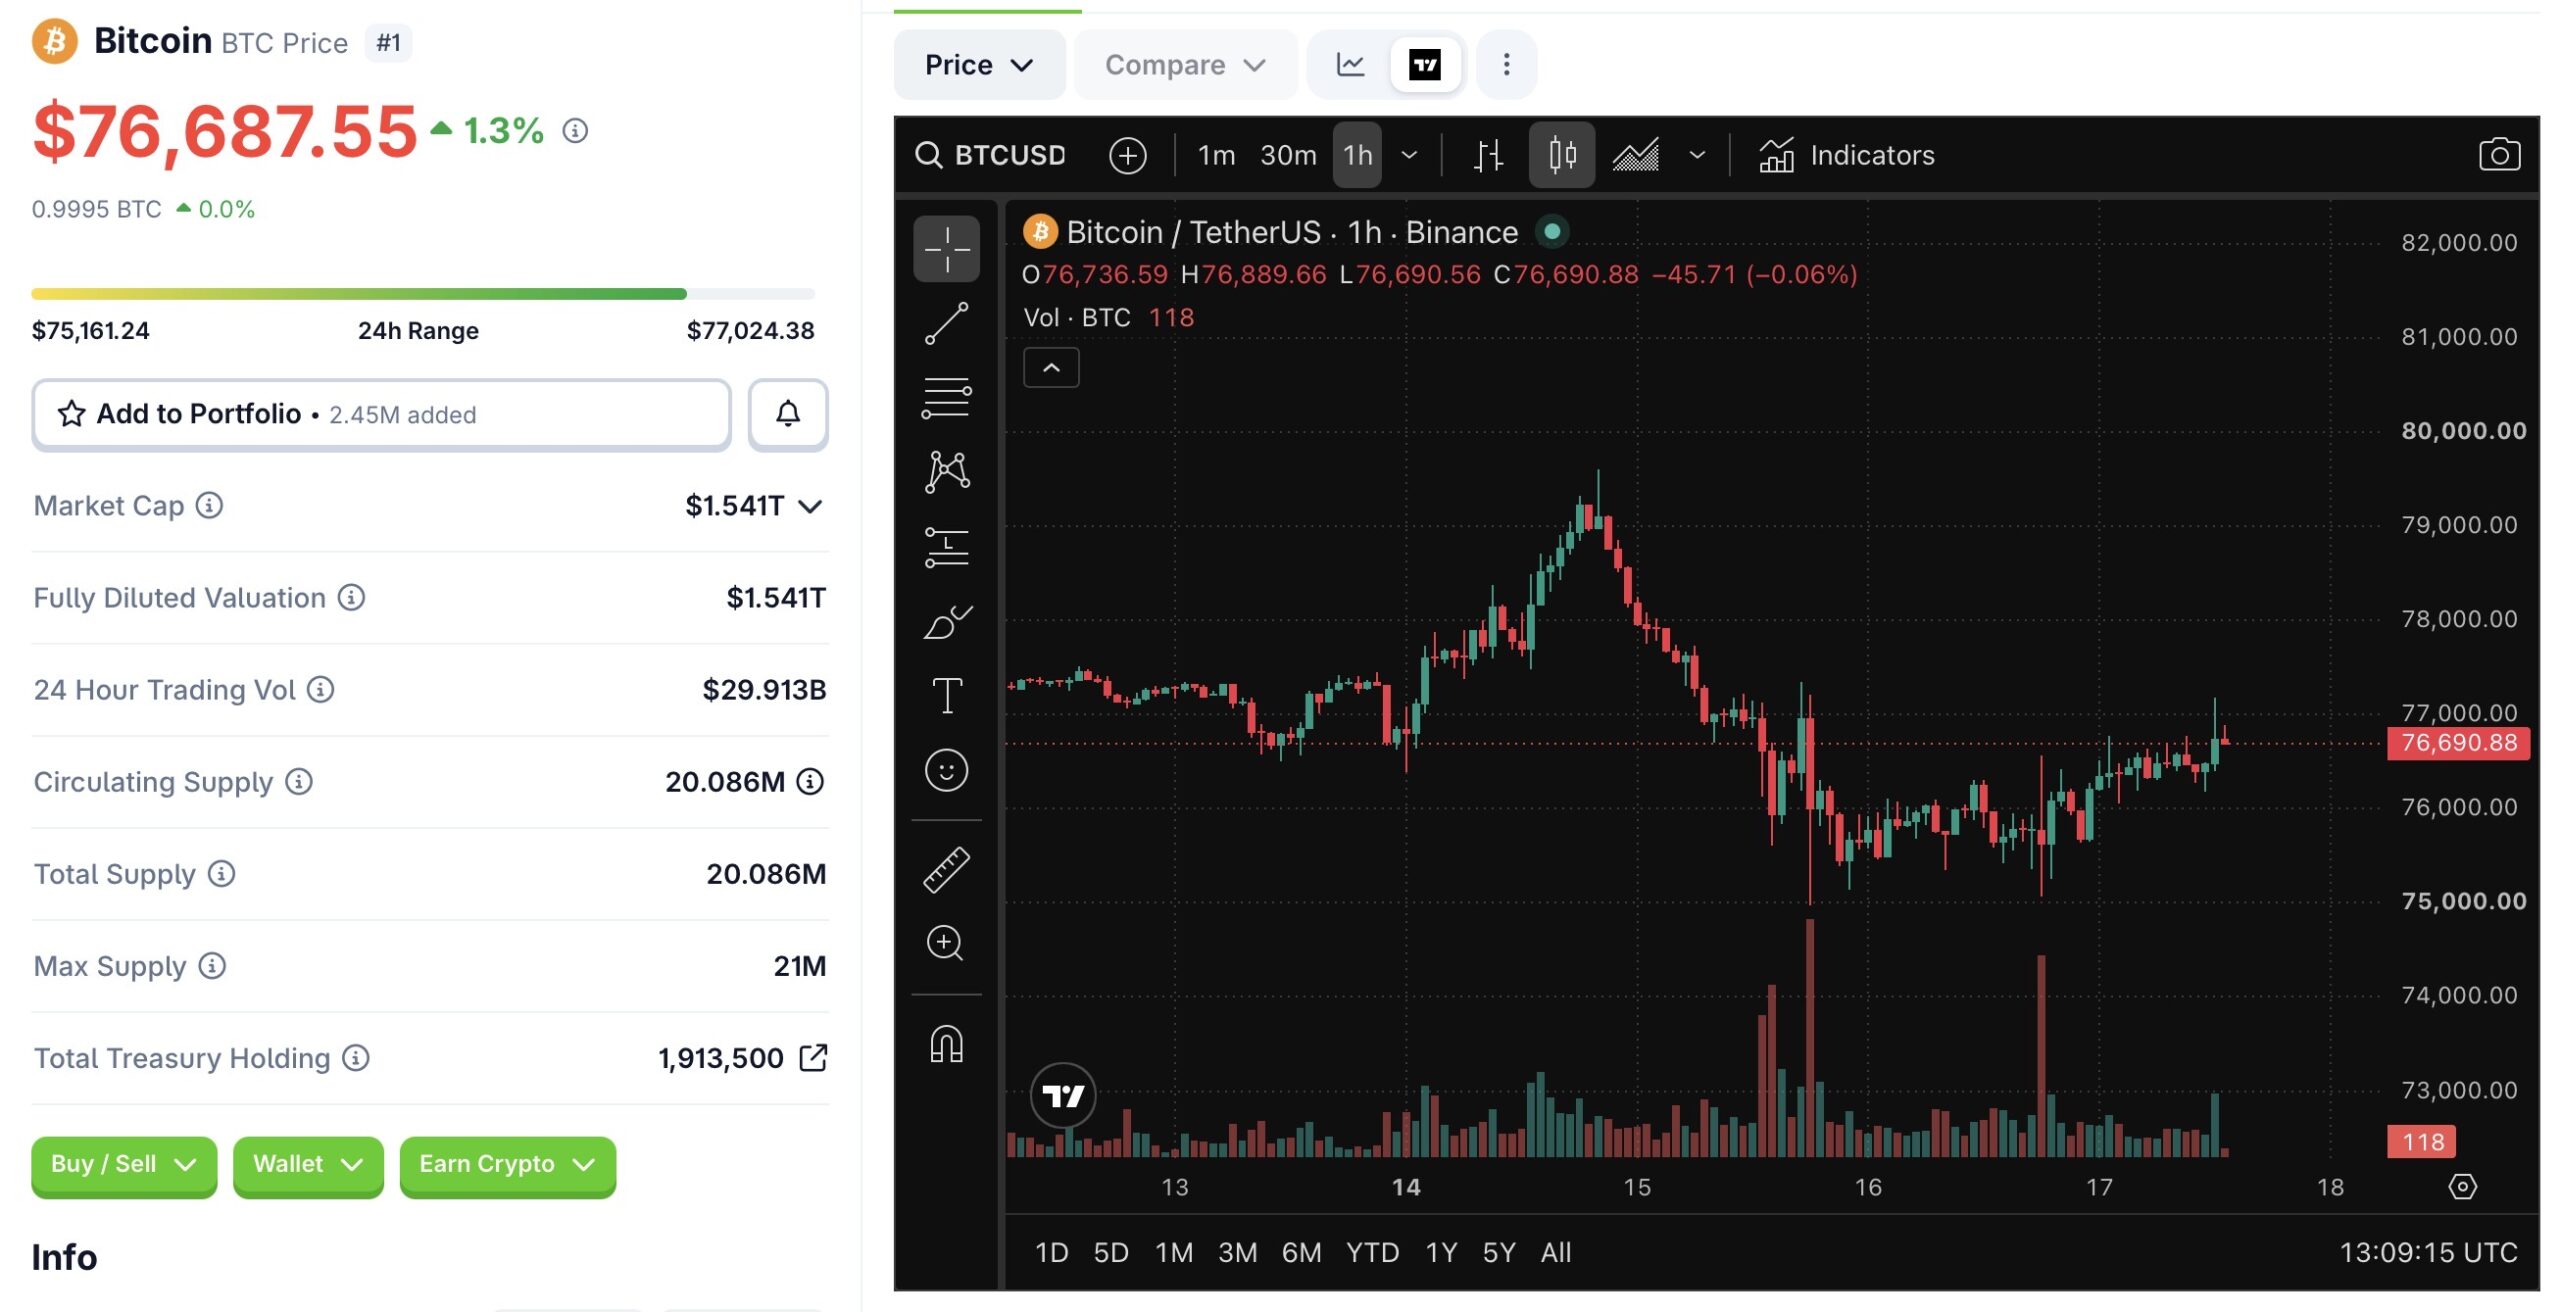
Bitcoin’s chart structure remains neutral, with price trading between 38.2% Fibonacci support at $75,278 and resistance near the seven-day simple moving average at $76,825. This relatively narrow range leaves the market waiting for a clearer directional signal.
A daily close above $76,825 would be a technical indication of improving momentum and could support a retest of higher levels. Conversely, a move below $75,278 would renew bearish pressure and put $74,000 in focus. Volume is down 22.5%, suggesting limited conviction behind either a sustained advance or a decisive breakdown.
Join Coinspeaker’s $1,000 Prize Drop on BybitDo Open Interest and Liquidations Point to a Real Bitcoin Trend?
$BTC Refuses to go down with Open Interest staying elevated mostly from shorts trying to force it lower. Sign of strength imo. pic.twitter.com/lag1cx1cSd
— exitpump (@exitpumpBTC) September 17, 2026
Derivatives data also points to a calmer market rather than a strong directional move. Total open interest was nearly flat, down 0.49%, while Bitcoin liquidations fell 66.46% to $76.73 million over 24 hours. The figures indicate that recent volatility has reduced overleveraged positions that could otherwise have amplified price swings.
Lower liquidation pressure may provide a more stable base for price action, but it does not by itself establish renewed demand. U.S. spot Bitcoin ETF flows remain an important sentiment signal after spot Bitcoin ETFs recorded a $450 million outflow on September 15.
You’re Still Early: 10 AI Agent Coins That Could Win Big Next Bullrun
What a Close Above $76,825 Or a Break Below $75,278 Would Mean
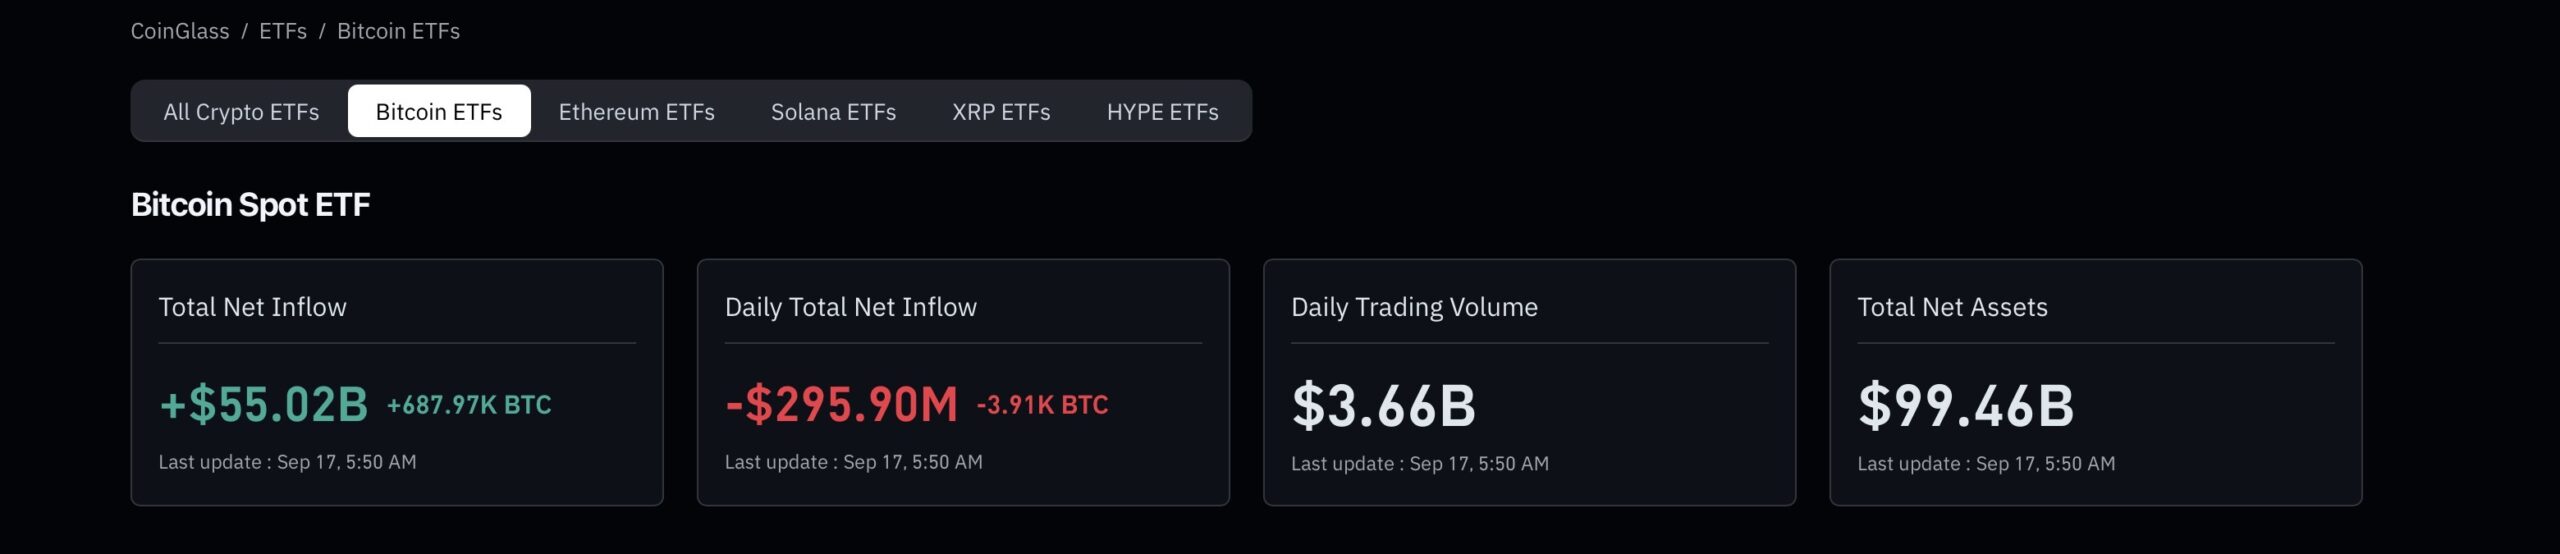
The bullish case remains conditional rather than confirmed. A daily close above $76,825 would suggest Bitcoin is regaining momentum after its recent consolidation. ETF flows are the key test: U.S. spot Bitcoin ETFs lost about $746 million over September 15 and 16.
The bearish case is defined by the range’s lower boundary. A break below $75,278 could push Bitcoin toward $74,000. Macro pressure adds to the risk. The Fed raised rates by 25 basis points on September 16, to a 3.75%-4.00% range. Bitcoin briefly spiked to $76,499.99 after the decision but gave up the gain within half an hour. Its correlation of roughly -0.46 with the S&P 500 also highlights the role of macro sentiment.
For now, the $75,278–$76,825 range remains the central framework. Traders are watching Japan’s September 18 rate decision for the next signal. Until Bitcoin closes decisively beyond either level, the setup is best viewed as neutral consolidation.
Don’t Miss: ETF Experts Predict The Next Crypto to Explode in 2026


