




 Some of the links on this site may be affiliate links. ICOBench may receive advertising commissions when users visit recommended platforms via our affiliate links, at no additional cost to you. All recommendations are based on a comprehensive review process.
In XRP news today, heading into mid-August 2026, Ripple’s XRP is trading near $1.07, pinned below its 50-day SMA of $1.11 and its 200-day SMA of $1.36, with the $1.048–$1.05 zone absorbing selling pressure that analysts are now calling a defining test for the token’s near-term trajectory.
The 14-day RSI sits at 41.36, tilted toward sellers but not yet signaling capitulation. August has historically delivered sharp drawdowns for XRP, and the structural setup entering this month does little to argue against that seasonal tendency repeating.
The open question the market must now resolve is whether the $1.048–$1.05 battlefield holds long enough for bulls to rebuild momentum toward $1.10 and beyond, or whether sustained selling pressure breaks the floor and opens a direct path toward the psychological $1 support.
XRP News: What the $1.048 Battlefield and SMA Cross Actually Reveal About the $1 Trapdoor Risk
The $1.048–$1.05 zone on the 4-hour chart is a crucial bearish area, indicating that XRP needs to hold $1.05, reclaim $1.083, and close above $1.10 for a bullish outlook. Each step is a critical barrier.
@ChartNerdTA underscored historical trends, noting that XRP has consistently closed lower in August during US midterm election years, with an average decline of around 14%. If the pattern holds, a drop could target $0.88.
Finbold’s machine learning forecast predicts XRP’s average price at $1.01 by August 31, 2026, indicating a 4.47% decline. The most bearish estimate is $0.99, while the most optimistic is $1.04.
Support levels are clear: failure to hold $1.048 could lead to the $1.00–$1.008 range, risking a drop to $0.88. Resistance levels are at $1.14, $1.183, $1.20, and $1.30, with the $1.20–$1.45 zone limiting recovery efforts.
The XRP chart couldn't be clearer.
Ripple could lead this bull market.
$10+ $XRP is a very realistic target. pic.twitter.com/lbTDgTFUqD
— Maxi (@Maxi_Dec2020) August 6, 2026
Bull case: XRP holds the $1.048–$1.05 zone on a closing body basis, reclaims $1.083, and posts a confirmed 4-hour close above $1.10, opening targets at $1.14, $1.183, and ultimately $1.20, the level that would signal a meaningful structural shift.
Base case: XRP grinds between $1.00 and $1.10 through mid-August, consolidating near the lower end of its recent range without triggering a decisive breakdown or a convincing recovery, consistent with the machine learning model’s $1.01 average target for August 31.
Bear case: A closing body below $1.048 sends XRP toward the $1.00–$1.008 liquidity pocket. Failure to hold $1.00 on a daily close basis accelerates selling toward the $0.88 mid-Gaussian Channel level identified by ChartNerd’s midterm election year pattern, roughly an 18% decline from current prices.
The CLARITY Act and Institutional Catalysts: What the August Policy Window Actually Reveals About XRP’s Structural Ceiling
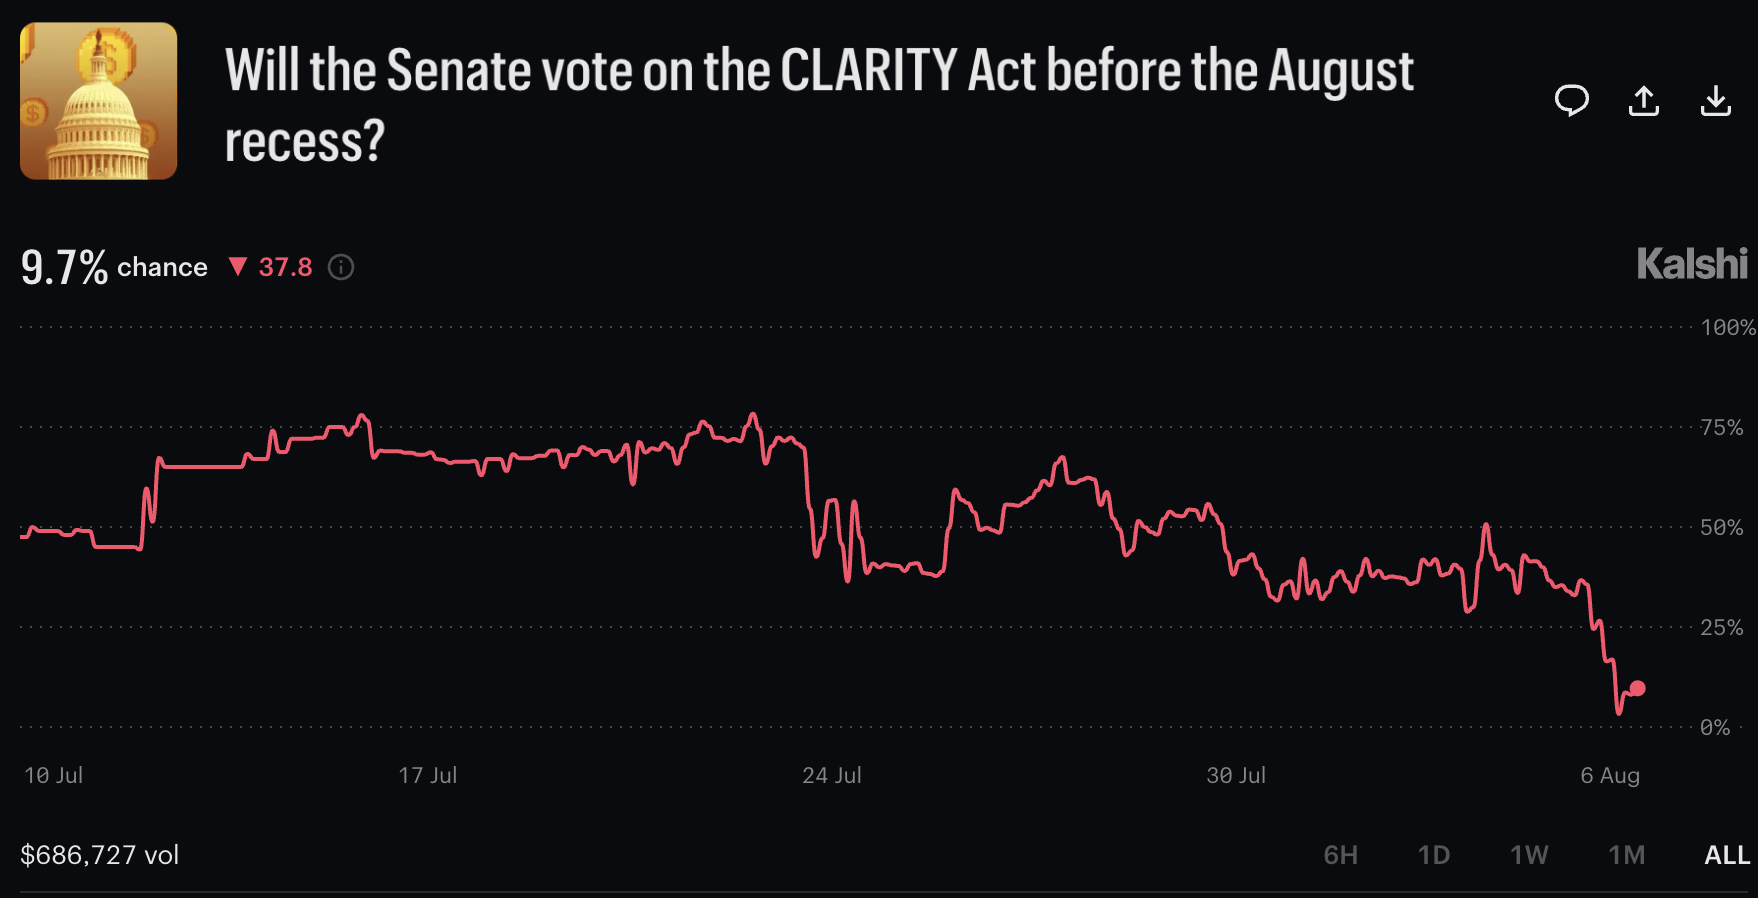
In other XRP news, the bearish technical setup for Ripple is accompanied by fundamental catalysts that could cause significant volatility. The CLARITY Act review, with President Trump’s response pending, could greatly impact crypto regulation, potentially moving XRP by double digits. A positive outcome may encourage institutional investment and help breach the $1.10 threshold.
On the corporate front, Evernorth, a Ripple-backed firm, is progressing with its merger with Armada Acquisition Corp II. Recent filings confirm the deal remains active, indicating ongoing institutional demand for XRP, which is crucial for long-term price forecasts.
Additionally, mid-August US inflation data and Federal Reserve communications from Jackson Hole present external risks that could either push XRP below $1 or test the $1.18–$1.20 resistance.
With bearish sentiment already priced in for XRP, ADA, and SOL, the prospects for a bullish reversal are challenging, with limited margin for error at current support levels.