
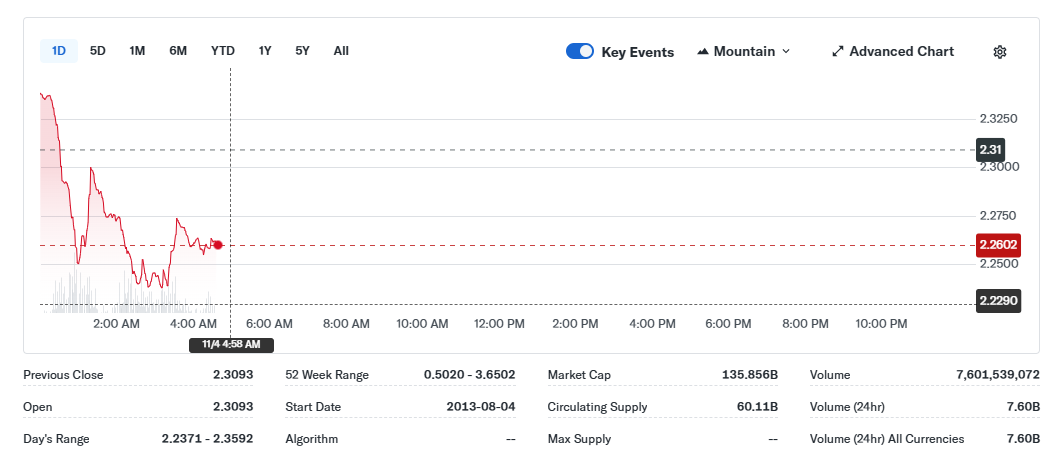
XRP news today is a sharp 6.24% drop, which has traders on edge as the token plunged from $2.65 to $2.26 within hours, slicing through the crucial $2.46 support. Volume exploded to $7.58B – over 100% higher than average – confirming intense selling.
Analysts cite institutional exit pressure and a pattern of cyclical exhaustion as key drivers of the drop, while rising interest in early-stage tokens like Bitcoin Hyper hints at where capital might flow next.
Institutional Selloff Accelerates Breakdown
XRP’s breakdown began with two intense selling waves, ultimately pushing the price below $2.46 – a level that had held for over a month.
A staggering 392.6 million XRP was dumped during the session, nearly 400% of its daily average, with most trades concentrated in short bursts between $2.65 and $2.48.
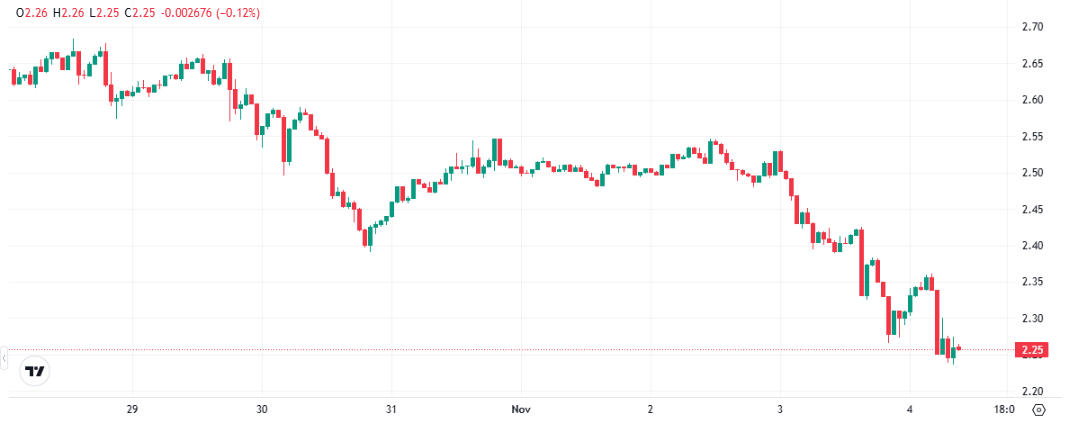
Behind the scenes, macro pressure from the Federal Reserve’s hawkish stance added fuel to the fire. Even improving U.S.–China trade sentiment couldn’t offset the bearish tilt. Technical analysts quickly flagged a confirmed bear setup, and the price action followed with precision.
Support Fails, Trend Shifts Bearish
The $2.46 level, once a pillar of XRP’s consolidation range, has now flipped into resistance. Indicators such as RSI and MACD signal weakening momentum.
More worryingly, the volume spike during the fall was followed by muted recovery volume, a hallmark of distribution – not accumulation.
Now, analysts are eyeing potential downside targets near $2.30 to $2.40, unless XRP can reclaim the $2.46–$2.50 zone quickly. So far, buyers appear reluctant, and the technical setup remains fragile.
12-Month Pattern Could Still Trigger Major Rebound
Zooming out, XRP’s price history shows a unique 12 to 13-month rhythm – rallies and corrections that follow a near-clockwork cycle:
- 2014–2016: Accumulation phases led to future volatility
- 2017–2018: Bull run, followed by a double-length bear market
- 2020–2022: Rally, correction, then sideways
- 2023–2025: Now tracking the same rhythm again
If this pattern holds, XRP could still be setting up for a significant directional move in the coming months. Time-based analysis now points toward a potential upside inflection – but not before the current weakness plays out.
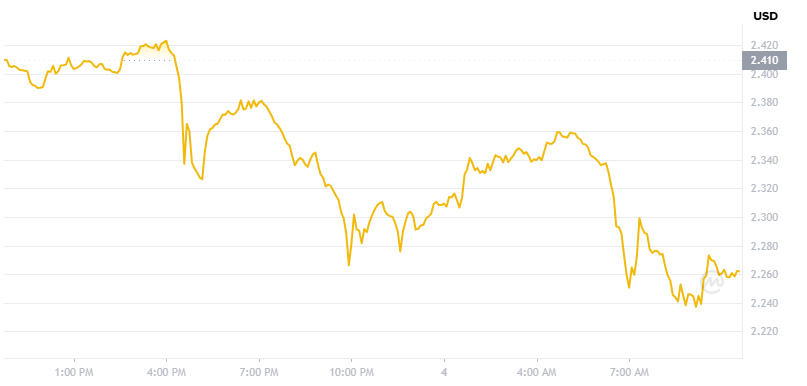
$2.35 Level Becomes Critical Launchpad Zone
Data from on-chain heatmaps shows heavy accumulation clusters between $2.52 and $2.54, marking that range as a potential springboard for future rallies. However, XRP is now flirting with its lower support zone at $2.30–$2.35.
On the 4-hour chart, RSI has dropped below the 14-day EMA, reinforcing bearish pressure. Yet, oversold signals are emerging, raising the odds of a short-term bounce.
If XRP can reclaim $2.50 with conviction, the narrative could flip fast. But without meaningful volume and macro support, analysts remain cautious.
Bitcoin Hyper Gains Attention as XRP Loses Steam

As XRP struggles to stabilize, traders are rotating into early-stage presale tokens with upside potential. One standout is Bitcoin Hyper ($HYPER) – which has now raised over $25.7M out of its $26M cap.
The presale buzz comes from stage-based pricing, a low $0.013 entry, and rising whale participation. With just hours left until the next price hike, $HYPER is capturing the same risk-on momentum XRP once led – especially among traders looking for the next explosive narrative.
What Comes Next?
The bears currently have the edge on XRP. Unless the token reclaims the $2.46–$2.50 resistance zone, downside to $2.30 or even lower remains probable. Still, if macro shifts or buyer pressure return, XRP could re-enter its historical rhythm and surprise markets again.
For now, all eyes are on volume, institutional flows, and whether alternative tokens like Bitcoin Hyper continue absorbing the capital that XRP just lost.